房价预测(基于决策树算法)
预测波士顿房价
第一步. 导入数据
在这个项目中,将使用波士顿房屋信息数据来训练和测试一个模型,并对模型的性能和预测能力进行评估。我们希望可以通过该模型实现对房屋的价值预估,提高房地产经纪人的工作效率。
此项目的数据集来自kaggle原始数据,未经过任何处理。该数据集统计了2006年至2010年波士顿个人住宅销售情况,包含2900多条观测数据(其中一半是训练数据,即我们的housedata.csv文件)。更多文档信息可以参考作者的文档,以及项目附件data_description.txt文件(特征描述文件)。
下面区域的代码用以载入一些此项目所需的Python库。
# 载入此项目需要的库
import numpy as np
import pandas as pd
import visuals as vs # Supplementary code 补充的可视化代码

import matplotlib.pyplot as plt
import seaborn as sns
plt.style.use('seaborn') # use seaborn style 使用seaborn风格

import warnings
warnings.filterwarnings('ignore')

%matplotlib inline
print('你已经成功载入所有库!')
你已经成功载入所有库!
加载数据
# 载入波士顿房屋的数据集:使用pandas载入csv,并赋值到data_df
data_df = pd.read_csv('housedata.csv')

# 成功载入的话输出训练数据行列数目
print("Boston housing dataset has {} data points with {} variables each.".format(*data_df.shape))
Boston housing dataset has 1460 data points with 81 variables each.
第二步. 数据分析
这个部分,将对已有的波士顿房地产数据进行初步的观察与处理。
由于这个项目的最终目标是建立一个预测房屋价值的模型,需要将数据集分为特征(features)和目标变量(target variable)。
- 目标变量:
'SalePrice',是我们希望预测的变量。 - 特征:除
'SalePrice'外的属性都是特征,它们反应了数据点在某些方面的表现或性质。
观察数据
对波士顿房价的数据进行观察,从而掌握更多数据本身的信息。
(1)使用 head方法 打印并观察前7条data_df数据
# 打印出前7条data_df
print(data_df.head(7))
   Id  MSSubClass MSZoning  LotFrontage  LotArea Street Alley LotShape  \
0   1          60       RL         65.0     8450   Pave   NaN      Reg
1   2          20       RL         80.0     9600   Pave   NaN      Reg
2   3          60       RL         68.0    11250   Pave   NaN      IR1
3   4          70       RL         60.0     9550   Pave   NaN      IR1
4   5          60       RL         84.0    14260   Pave   NaN      IR1
5   6          50       RL         85.0    14115   Pave   NaN      IR1
6   7          20       RL         75.0    10084   Pave   NaN      Reg

  LandContour Utilities  ... PoolArea PoolQC  Fence MiscFeature MiscVal  \
0         Lvl    AllPub  ...        0    NaN    NaN         NaN       0
1         Lvl    AllPub  ...        0    NaN    NaN         NaN       0
2         Lvl    AllPub  ...        0    NaN    NaN         NaN       0
3         Lvl    AllPub  ...        0    NaN    NaN         NaN       0
4         Lvl    AllPub  ...        0    NaN    NaN         NaN       0
5         Lvl    AllPub  ...        0    NaN  MnPrv        Shed     700
6         Lvl    AllPub  ...        0    NaN    NaN         NaN       0

  MoSold YrSold  SaleType  SaleCondition  SalePrice
0      2   2008        WD         Normal     208500
1      5   2007        WD         Normal     181500
2      9   2008        WD         Normal     223500
3      2   2006        WD        Abnorml     140000
4     12   2008        WD         Normal     250000
5     10   2009        WD         Normal     143000
6      8   2007        WD         Normal     307000

[7 rows x 81 columns]
(2)Id特征对我们训练数据没有任何用处,在data_df中使用drop方法删除'Id'列数据
# 删除data_df中的Id特征(保持数据仍在data_df中,不更改变量名)
data_df.drop('Id',axis=1,inplace=True)
(3)使用describe方法观察data_df各个特征的统计信息:
data_df.describe()
| MSSubClass | LotFrontage | LotArea | OverallQual | OverallCond | YearBuilt | YearRemodAdd | MasVnrArea | BsmtFinSF1 | BsmtFinSF2 | ... | WoodDeckSF | OpenPorchSF | EnclosedPorch | 3SsnPorch | ScreenPorch | PoolArea | MiscVal | MoSold | YrSold | SalePrice | |
|---|---|---|---|---|---|---|---|---|---|---|---|---|---|---|---|---|---|---|---|---|---|
| count | 1460.000000 | 1201.000000 | 1460.000000 | 1460.000000 | 1460.000000 | 1460.000000 | 1460.000000 | 1452.000000 | 1460.000000 | 1460.000000 | ... | 1460.000000 | 1460.000000 | 1460.000000 | 1460.000000 | 1460.000000 | 1460.000000 | 1460.000000 | 1460.000000 | 1460.000000 | 1460.000000 |
| mean | 56.897260 | 70.049958 | 10516.828082 | 6.099315 | 5.575342 | 1971.267808 | 1984.865753 | 103.685262 | 443.639726 | 46.549315 | ... | 94.244521 | 46.660274 | 21.954110 | 3.409589 | 15.060959 | 2.758904 | 43.489041 | 6.321918 | 2007.815753 | 180921.195890 |
| std | 42.300571 | 24.284752 | 9981.264932 | 1.382997 | 1.112799 | 30.202904 | 20.645407 | 181.066207 | 456.098091 | 161.319273 | ... | 125.338794 | 66.256028 | 61.119149 | 29.317331 | 55.757415 | 40.177307 | 496.123024 | 2.703626 | 1.328095 | 79442.502883 |
| min | 20.000000 | 21.000000 | 1300.000000 | 1.000000 | 1.000000 | 1872.000000 | 1950.000000 | 0.000000 | 0.000000 | 0.000000 | ... | 0.000000 | 0.000000 | 0.000000 | 0.000000 | 0.000000 | 0.000000 | 0.000000 | 1.000000 | 2006.000000 | 34900.000000 |
| 25% | 20.000000 | 59.000000 | 7553.500000 | 5.000000 | 5.000000 | 1954.000000 | 1967.000000 | 0.000000 | 0.000000 | 0.000000 | ... | 0.000000 | 0.000000 | 0.000000 | 0.000000 | 0.000000 | 0.000000 | 0.000000 | 5.000000 | 2007.000000 | 129975.000000 |
| 50% | 50.000000 | 69.000000 | 9478.500000 | 6.000000 | 5.000000 | 1973.000000 | 1994.000000 | 0.000000 | 383.500000 | 0.000000 | ... | 0.000000 | 25.000000 | 0.000000 | 0.000000 | 0.000000 | 0.000000 | 0.000000 | 6.000000 | 2008.000000 | 163000.000000 |
| 75% | 70.000000 | 80.000000 | 11601.500000 | 7.000000 | 6.000000 | 2000.000000 | 2004.000000 | 166.000000 | 712.250000 | 0.000000 | ... | 168.000000 | 68.000000 | 0.000000 | 0.000000 | 0.000000 | 0.000000 | 0.000000 | 8.000000 | 2009.000000 | 214000.000000 |
| max | 190.000000 | 313.000000 | 215245.000000 | 10.000000 | 9.000000 | 2010.000000 | 2010.000000 | 1600.000000 | 5644.000000 | 1474.000000 | ... | 857.000000 | 547.000000 | 552.000000 | 508.000000 | 480.000000 | 738.000000 | 15500.000000 | 12.000000 | 2010.000000 | 755000.000000 |
8 rows × 37 columns
数据预处理
数据不可能是百分百的‘干净’数据(即有用数据),总会在采集整理时有些”失误“、“冗余”,造成“脏”数据,所以要从数据的正确性和完整性这两个方面来清理数据。
- 正确性:一般是指有没有异常值,比如我们这个数据集中作者的文档所说:
I would recommend removing any houses with more than 4000 square feet from the data set (which eliminates these five unusual observations) before assigning it to students.
建议我们去掉数据中'GrLivArea'中超过4000平方英尺的房屋(具体原因可以参考文档),当然本数据集还有其他的异常点,这里不再处理。 - 完整性:采集或者整理数据时所产生的空数据造成了数据的完整性缺失,通常我们会使用一定的方法处理不完整的数据。在本例中,我们使用以下两种方法,一是丢弃数据,即选择丢弃过多空数据的特征(或者直接丢弃数据行,前提是NA数据占比不多),二是填补数据,填补的方法也很多,均值中位数众数填充等等都是好方法。
正确性方面
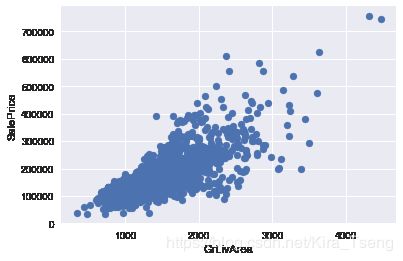
以下代码将使用matplotlib库中的scatter方法 绘制'GrLivArea'和'SalePrice'的散点图,x轴为'GrLivArea',y轴为'SalePrice',观察数据**
# 绘制散点图
plt.scatter(data_df['GrLivArea'],data_df['SalePrice'])
plt.xlabel('GrLivArea')
plt.ylabel('SalePrice')
plt.show()
**观察所得:通过上图我们可以看到那几个异常值,即'GrLivArea'大于4000,但是'SalePrice'又极低的数据,所以需要从data_df删除这几个异常值。
删除后重新绘制'GrLivArea'和'SalePrice'的关系图,确认异常值已删除。**
# 从data_df中删除 GrLivArea大于4000 且 SalePrice低于300000 的值
index_del = data_df[(data_df['GrLivArea'] > 4000) & (data_df['SalePrice'] < 300000)].index
data_df.drop(index=index_del, inplace=True)

# 重新绘制GrLivArea和SalePrice的关系图,确认异常值已删除
plt.scatter(data_df['GrLivArea'],data_df['SalePrice'])
plt.xlabel('GrLivArea')
plt.ylabel('SalePrice')
plt.show()
完整性方面
筛选出过多空数据的特征,这个项目定为筛选出有超过25%为空数据的特征
limit_percent = 0.25
limit_value = len(data_df) * limit_percent
# 统计并打印出超过25%的空数据的特征
list(data_df.columns[data_df.isna().sum() > limit_value])
['Alley', 'FireplaceQu', 'PoolQC', 'Fence', 'MiscFeature']
接着,查看data_description.txt文件,就会发现,这些并非一定是空缺数据,而没有游泳池,篱笆等也会用NA来表示,那么就不需要删除这些特征了,而是用None来填充NA数据。
以下将使用fillna方法填充空数据。
# 确定所有空特征
missing_columns = list(data_df.columns[data_df.isnull().sum() != 0])
# 确定哪些是类别特征,哪些是数值特征
missing_numerical = list(data_df[missing_columns].dtypes[data_df[missing_columns].dtypes != 'object'].index)
missing_category = [i for i in missing_columns if i not in missing_numerical]
print("missing_numerical:",missing_numerical)
print("missing_category:",missing_category)
missing_numerical: ['LotFrontage', 'MasVnrArea', 'GarageYrBlt']
missing_category: ['Alley', 'MasVnrType', 'BsmtQual', 'BsmtCond', 'BsmtExposure', 'BsmtFinType1', 'BsmtFinType2', 'Electrical', 'FireplaceQu', 'GarageType', 'GarageFinish', 'GarageQual', 'GarageCond', 'PoolQC', 'Fence', 'MiscFeature']
# 需要填充众数的特征
fill_Mode = ['Electrical']
# 需要填充None的特征
fill_None = ['Alley', 'MasVnrType', 'BsmtQual', 'BsmtCond', 'BsmtExposure', 'BsmtFinType1',
             'BsmtFinType2', 'FireplaceQu', 'GarageType', 'GarageFinish', 'GarageQual',
             'GarageCond', 'PoolQC', 'Fence', 'MiscFeature']
# 需要填充0的特征
fill_0 = ['GarageYrBlt']
# 需要填充中位数的特征
fill_median = ['LotFrontage', 'MasVnrArea']

# 按需填补上面数据
data_df[fill_Mode] = data_df[fill_Mode].fillna(data_df[fill_Mode].mode())
data_df[fill_None] = data_df[fill_None].fillna('None')
data_df[fill_0] = data_df[fill_0].fillna(0)
data_df[fill_median] = data_df[fill_median].fillna(data_df[fill_median].mean())
特征分析
有这么一句话在业界广泛流传:特征数据决定了机器学习的上限,而模型和算法只是逼近这个上限而已。特征工程,是整个数据分析过程中不可缺少的一个环节,其结果质量直接关系到模型效果和最终结论。从上面两步中我们得到了“干净”的数据,但是data_df总共有81个特征,应当剔除那些无关紧要的特征(噪声),使用真正关键的特征来进行模型训练。现在需要我们对这些庞大的数据进行分析,提取出与目标最为关联的数据。
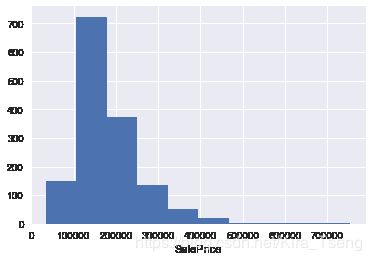
绘制'SalePrice'的直方图,观察该直方图属于什么分布
# 绘制直方图
plt.hist(data_df['SalePrice'])
plt.xlabel('SalePrice')
plt.show()
观察结论:'SalePrice'属于正偏态分布。
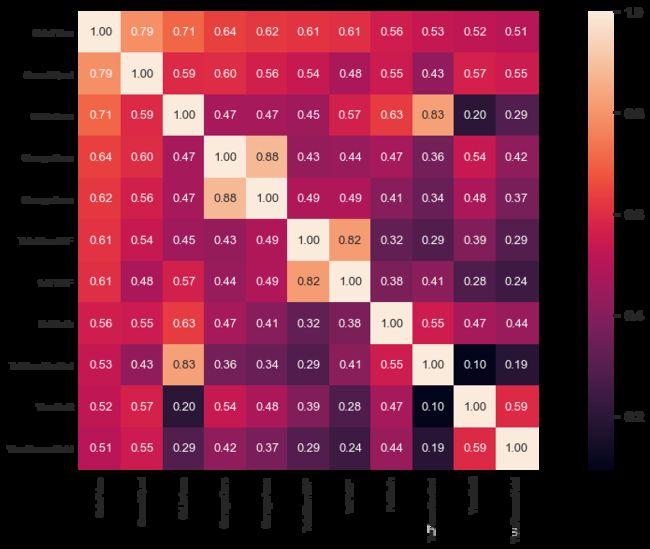
如果特征极其多,很难清晰的看到特征与目标变量之间的关系,就需要利用统计知识来进行多变量分析了。常用的方法可使用热图heatmap结合corr方法来进行客观分析,热图Heatmap可以用颜色变化来反映变量之间的相关性二维矩阵或说相关性表格中的数据信息,它可以直观地将数据值的大小以定义的颜色深浅表示出来。
这个项目,为了简化训练,将以相关性绝对值大于0.5为界来选取所需要的特征。
corrmat = data_df.corr().abs()
top_corr = corrmat[corrmat["SalePrice"]>0.5].sort_values(by = ["SalePrice"], ascending = False).index
cm = abs(np.corrcoef(data_df[top_corr].values.T))
f, ax = plt.subplots(figsize=(20, 9))
sns.set(font_scale=1.3)
hm = sns.heatmap(cm, cbar=True, annot=True,
                 square=True, fmt='.2f', annot_kws={'size': 13},
                 yticklabels=top_corr.values, xticklabels=top_corr.values);
data_df = data_df[top_corr]
接下来,我们从创造性方面来对我们的特征进行“改造”。
- 创造性:创造性主要是说两种情况,一种是对现有数据的处理,比如对类别的独热编码(One-hotEncoder)或者标签编码(LabelEncoder),数值的区间缩放,归一化,标准化等等。另一种就是根据某一个或多个特征创造一个新的特征,例如某特征按组分类(groupby)后,或者某些特征组合后来创造新特征等等。
因为筛选出来的特征都为数值类型特征,所以只做标准化的操作:这个项目是一个回归类型的项目,而回归算法对标准正态分步预测较为准确,从目标数据可以看出数据是一个偏态分布,那么将使用log将数据从偏态分布转换为标准正态分布,最后进行标准化。
from scipy.special import boxcox1p
from sklearn.preprocessing import StandardScaler

data_df['SalePrice'] = np.log1p(data_df['SalePrice'])
numeric_features = list(data_df.columns)
numeric_features.remove('SalePrice')
for feature in numeric_features:
    #all_data[feat] += 1
    data_df[feature] = boxcox1p(data_df[feature], 0.15)

scaler = StandardScaler()
scaler.fit(data_df[numeric_features])
data_df[numeric_features] = scaler.transform(data_df[numeric_features])
第三步. 建立模型
。
定义衡量标准
如果不能对模型的训练和测试的表现进行量化地评估,就很难衡量模型的好坏。通常需要定义一些衡量标准,这些标准可以通过对某些误差或者拟合程度的计算来得到。在这个项目中,将通过运算决定系数 R 2 R^2 R2 来量化模型的表现。模型的决定系数是回归分析中十分常用的统计信息,经常被当作衡量模型预测能力好坏的标准。
R 2 R^2 R2 的数值范围从0至1,表示目标变量的预测值和实际值之间的相关程度平方的百分比。一个模型的 R 2 R^2 R2 值为0还不如直接用平均值来预测效果好;而一个 R 2 R^2 R2 值为1的模型则可以对目标变量进行完美的预测。从0至1之间的数值,则表示该模型中目标变量中有百分之多少能够用特征来解释。模型也可能出现负值的 R 2 R^2 R2,这种情况下模型所做预测有时会比直接计算目标变量的平均值差很多。
在下方代码的 performance_metric 函数中,将实现:
- 使用
sklearn.metrics中的r2_score来计算y_true和y_predict的 R 2 R^2 R2 值,作为对其表现的评判。 - 将他们的表现评分储存到
score变量中。
# 引入 'r2_score'
from sklearn.metrics import r2_score

def performance_metric(y_true, y_predict):
    """ Calculates and returns the performance score between
        true and predicted values based on the metric chosen. """

    # 计算 'y_true' 与 'y_predict' 的r2值
    score = r2_score(y_true, y_predict)

    # 返回这一分数
    return score
拟合程度
假设一个数据集有五个数据且某一模型做出下列目标变量的预测:
| 真实数值 | 预测数值 |
|---|---|
| 3.0 | 2.5 |
| -0.5 | 0.0 |
| 2.0 | 2.1 |
| 7.0 | 7.8 |
| 4.2 | 5.3 |
提示: R 2 R^2 R2 分数是指可以从自变量中预测的因变量的方差比例。 换一种说法:
- R 2 R^2 R2 为0意味着因变量不能从自变量预测。
- R 2 R^2 R2 为1意味着可以从自变量预测因变量。
- R 2 R^2 R2 在0到1之间表示因变量可预测的程度。
- R 2 R^2 R2 为0.40意味着 Y 中40%的方差可以从 X 预测。
下方的代码将使用 performance_metric 函数来计算 y_true 和 y_predict 的决定系数。
# 计算这一模型的表现
score = performance_metric([3, -0.5, 2, 7, 4.2], [2.5, 0.0, 2.1, 7.8, 5.3])
print("Model has a coefficient of determination, R^2, of {:.3f}.".format(score))
Model has a coefficient of determination, R^2, of 0.923.
结论:这个模型已经成功地描述目标变量的变化了。因为 R 2 R^2 R2 分数已高达0.923,说明因变量的可预测程度非常高。
数据分割与重排
接下来,将分割波士顿房屋数据集,包括特征与目标变量、训练集和测试集。通常在这个过程中,数据也会被重排,以消除数据集中由于顺序而产生的偏差。
将data_df分割为特征和目标变量
# 分割
labels = data_df['SalePrice']  #TODO:提取SalePrice作为labels
features = data_df.drop(['SalePrice'], axis=1)  #TODO:提取除了SalePrice以外的特征赋值为features
下方代码将实现:
- 使用
sklearn.model_selection中的train_test_split, 将features和prices的数据都分成用于训练的数据子集和用于测试的数据子集。- 分割比例为:80%的数据用于训练,20%用于测试;
- 选定一个数值以设定
train_test_split中的random_state,这会确保结果的一致性;
- 将分割后的训练集与测试集分配给
X_train,X_test,y_train和y_test。
# 引入 'train_test_split'
from sklearn.model_selection import train_test_split

# 打乱并分割训练集与测试集
X_train, X_test, y_train, y_test = train_test_split(features, labels, test_size=0.2, random_state=1)

# 成功~
print("Training and testing split was successful.")
Training and testing split was successful.
训练及测试
-
将数据集按一定比例分为训练用的数据集和测试用的数据集对学习算法能在一定程度上避免过拟合。
-
如果用模型已经见过的数据,例如部分训练集数据进行测试,会使得计算准确率时,这个得分会不可靠。
第四步. 分析模型的表现
在项目的第四步,我们来观察不同参数下,模型在训练集和验证集上的表现。这里,我们专注于一个特定的算法(带剪枝的决策树DecisionTreeRegressor)和这个算法的一个参数 'max_depth'。
接下来,用全部训练集训练,选择不同'max_depth' 参数,观察这一参数的变化如何影响模型的表现。并画出模型的表现来分析。
学习曲线
下方区域内的代码会输出四幅图像,它们是一个决策树模型在不同最大深度下的表现。每一条曲线都直观得显示了随着训练数据量的增加,模型学习曲线在训练集评分和验证集评分的变化,评分使用决定系数 R 2 R^2 R2。曲线的阴影区域代表的是该曲线的不确定性(用标准差衡量)。
# Produce learning curves for varying training set sizes and maximum depths
vs.ModelLearning(features, labels)
学习曲线结论观察
- 对于上述图像中的最大深度为 3 的那个,随着训练数据量的增加,训练集曲线的评分减少,验证集曲线的增加。
- 如果有更多的训练数据,也无法提升模型的表现,因训练集曲线和验证集曲线已相交在一个数值。
复杂度曲线
下列代码内的区域会输出一幅图像,它展示了一个已经经过训练和验证的决策树模型在不同最大深度条件下的表现。这个图形将包含两条曲线,一个是训练集的变化,一个是验证集的变化。跟学习曲线相似,阴影区域代表该曲线的不确定性,模型训练和测试部分的评分都用的 performance_metric 函数。
vs.ModelComplexity(X_train, y_train)
偏差(bias)与方差(variance)之间的权衡取舍
提示: 高偏差表示欠拟合(模型过于简单),而高方差表示过拟合(模型过于复杂,以至于无法泛化)。
观察结论:
- 当模型以最大深度 1训练时,模型的预测出现了很大的偏差。
- 当模型以最大深度10训练时,模型的预测出现了很大的方差。
- 当模型以最大深度 1训练时,训练集得分和验证集得分都较低,可见是欠拟合的情况。当模型以最大深度10训练时,训练集得分极高和验证集得分不太高,而两个得分相差甚大,可见是过拟合的情况。
最优模型的猜测
- 结合复杂度曲线,可见最大深度是 4 的模型能够最好地对未见过的数据进行预测。
- 依据:随着最大深度的增加,训练集得分和验证集得分都在增加,但当最大深度超过4后,验证集得分反而有下降的趋势,说明模型变得越来越复杂,逐渐变得过拟合。
第五步. 评估模型的表现
在项目的最后一节中,将构建一个模型,并使用 fit_model 中的优化模型去预测客户特征集。
网格搜索(Grid Search)
- 网格搜索法是穷举所有参数的组合,找出使模型得分最高的那个组合。比如在决策树模型里,分别用几个不同的深度参数去训练模型并计算其测试集得分,测试集得分最高模型对应的深度参数便是最优参数。
- 优化模型方法:尝试所有参数的组合,以发现能使模型性能最好的参数组合。
交叉验证
- K折交叉验证法(k-fold cross-validation)是随机将训练集划分成K份,依次将其中的一份作为验证集,其余的作为训练集,训练K个模型,最后选择模型表现得最好的那一个。
- GridSearchCV 是通过交叉验证得到每个参数组合的得分,以确定最优的参数组合。
- GridSearchCV 中的
'cv_results_'属性能生成一个字典,记录每组网格参数每次的训练结果,包括训练/验证时间、训练/验证评估分数以及相关时间和评分的统计信息。 - K折交叉验证可以尽可能地尝试所有的数据集划分方式,使网格搜索的结果可信度更高。K折交叉验证取多次结果的平均值可以避免样本划分不合理的情况。
训练最优模型
在这一步中,将使用决策树算法训练一个模型。为了得出的是一个最优模型,需要使用网格搜索法训练模型,以找到最佳的 'max_depth' 参数。可以把'max_depth' 参数理解为决策树算法在做出预测前,允许其对数据提出问题的数量。
在下方 fit_model 函数中,将实现:
- 定义
'cross_validator'变量: 使用sklearn.model_selection中的KFold创建一个交叉验证生成器对象; - 定义
'regressor'变量: 使用sklearn.tree中的DecisionTreeRegressor创建一个决策树的回归函数; - 定义
'params'变量: 为'max_depth'参数创造一个字典,它的值是从1至10的数组; - 定义
'scoring_fnc'变量: 使用sklearn.metrics中的make_scorer创建一个评分函数;
将‘performance_metric’作为参数传至这个函数中; - 定义
'grid'变量: 使用sklearn.model_selection中的GridSearchCV创建一个网格搜索对象;将变量'regressor','params','scoring_fnc'和'cross_validator'作为参数传至这个对象构造函数中;
# Import 'make_scorer', 'DecisionTreeRegressor', and 'GridSearchCV'
from sklearn.metrics import make_scorer
from sklearn.tree import DecisionTreeRegressor
from sklearn.model_selection import GridSearchCV
from sklearn.model_selection import KFold


def fit_model(X, y):
    """ Performs grid search over the 'max_depth' parameter for a
        decision tree regressor trained on the input data [X, y]. """

    cross_validator = KFold(n_splits=10)

    # Create a decision tree regressor object
    regressor = DecisionTreeRegressor(random_state=1)

    # Create a dictionary for the parameter 'max_depth' with a range from 1 to 10
    params = {'max_depth':[i for i in range(1, 11)]}

    # Transform 'performance_metric' into a scoring function using 'make_scorer'
    scoring_fnc = make_scorer(performance_metric)

    # Create the grid search cv object --> GridSearchCV()
    # Make sure to include the right parameters in the object:
    # (estimator, param_grid, scoring, cv) which have values 'regressor', 'params', 'scoring_fnc', and 'cross_validator' respectively.
    grid = GridSearchCV(regressor, params, scoring_fnc, cv = cross_validator)

    # Fit the grid search object to the data to compute the optimal model
    grid = grid.fit(X, y)

    # Return the optimal model after fitting the data
    return grid.best_estimator_
第六步. 做出预测
当我们用数据训练出一个模型,它就可用于对新的数据进行预测。在我们的例子–决策树回归函数中,模型已经学会对新输入的数据“提问”,并返回对目标变量的预测值。现在可以用这些预测来获取未知目标变量的数据的信息,但是,输入的新数据必须不能是已有训练数据之中的。
最优模型
下方代码将决策树回归函数代入训练数据的集合,以得到最优化的模型。
# Fit the training data to the model using grid search
reg = fit_model(X_train, y_train)

# Produce the value for 'max_depth'
print("Parameter 'max_depth' is {} for the optimal model.".format(reg.get_params()['max_depth']))
Parameter 'max_depth' is 6 for the optimal model.
最终,使用确认好的参数来对测试数据进行预测,并来看看训练结果如何。
depth = 6
regressor = DecisionTreeRegressor(max_depth = depth)
regressor.fit(X_train, y_train)
y_pred = regressor.predict(X_test)
score = performance_metric(y_test, y_pred)
print("The R2 score is ",score)
The R2 score is 0.7520017488593774
训练结果情况:
-
模型的效果并不理想。
-
改进:1、需要更多的特征来训练模型;2、数据预处理时,空值的填充用错数值;3、试试换成线性回归模型。


