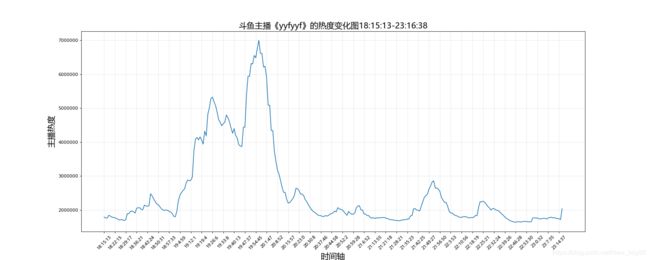
用Python写爬虫代码,记录斗鱼主播的热度变化情况,并绘制热度变化图。
为了关注某位主播热度的变化情况,特敲下以下代码。
本次程序导入了requests模块、time模块、lxml模块、matplotlib模块。
代码思维是:
- 根据输入的分区名称(area),向斗鱼(https://www.douyu.com/directory/all)发送请求获取响应,用xpath截取分区对应的链接;
- 向获取的新链接发送请求获取响应,用xpa替换截取对应主播的热度数据并用列表记录下来;
- 根据输入的间隔时间(interval,建议为60s)对步骤2进行循环,当主播下播时,则停止循环;
- 根据记录下来的数据,使用matplotlib绘制折线图,并保存图片;
- 主播下播后每隔一小时向网页发送请求,直到主播上播,继续循环2、3、4步骤。
代码如下,欢迎学习交流:

# coding=utf-8

import requests
import time
from lxml import etree
from matplotlib import font_manager
from matplotlib import pyplot as plt
from math import ceil


class Douyu_Spider:
    def __init__(self, area, name, interval):
        self.area = area
        self.name = name
        self.interval = interval
        self.headers = {
            "user-agent": "Mozilla/5.0 (Windows NT 10.0; WOW64) AppleWebKit/537.36 (KHTML, like Gecko) Chrome/65.0.3325.181 Safari/537.3", }
        self.hot_list = []
        self.time_list = []
        response = requests.get("https://www.douyu.com/directory/all", headers=self.headers)
        ret = response.content.decode()
        html = etree.HTML(ret)
        self.url_part = html.xpath('''//a[@title="{}"]/@href'''.format(self.area))[0]
        self.url = "https://www.douyu.com/{}".format(self.url_part)

    def parse_url(self,url):
        time_list = list(time.localtime())[3:6]
        time_str = str(time_list[0]) + ":" + str(time_list[1]) + ":" + str(time_list[2])
        self.time_list.append(time_str)
        print(time_str)
        response = requests.get(url, headers=self.headers)
        return response.content.decode()

    def get_info(self,html_str):
        html = etree.HTML(html_str)
        hot = html.xpath('''//h2[text()="{}"]/..//span[@class="DyListCover-hot is-template"]/text()'''.format(self.name))
        if len(hot)>0:
            hot = hot[0]
            if hot.count("万"):
                hot = float(hot[0:-1])*10000
            else:
                hot = float(hot[0:-1])
            self.hot_list.append(hot)
            print(hot)
            return False
        else:
            self.time_list.pop()
            return True

    def plot_hot(self):
        my_font1 = font_manager.FontProperties(fname='C:\Windows\Fonts\msyh.ttc', size=18)
        my_font2 = font_manager.FontProperties(fname='C:\Windows\Fonts\msyh.ttc', size=10)
        plt.figure(figsize=(20,8), dpi=80)
        x = range(len(self.time_list))
        plt.plot(x, self.hot_list)
        # 横坐标理想数为40
        if len(self.time_list)>40:
            x_interval = ceil(len(self.time_list)//40)
        else:
            x_interval = len(self.time_list)
        plt.xticks(x[::x_interval], self.time_list[::x_interval], fontproperties=my_font2, rotation=45)
        plt.xlabel('时间轴', fontproperties=my_font1)
        plt.ylabel('主播热度', fontproperties=my_font1)
        plt.title("斗鱼主播《{}》的热度变化图{}-{}".format(self.name, self.time_list[0], self.time_list[-1]), fontproperties=my_font1)
        plt.grid(alpha=0.3)
        file_name = "斗鱼主播《{}》的热度变化图{}-{}.png".format(self.name, self.time_list[0].replace(":","_"), self.time_list[-1].replace(":","_"))
        plt.savefig(file_name)


    def run(self):
        while True:
            time_list = list(time.localtime())[3:6]
            time_str = str(time_list[0]) + ":" + str(time_list[1]) + ":" + str(time_list[2])
            print("跟踪:{}".format(time_str))
            while True:
                # 1.发送请求,接受响应
                html_str = self.parse_url(self.url)
                # 2.每隔1min提取一次热度数据
                if self.get_info(html_str):
                    if len(self.hot_list)>0:
                        self.interval = len(self.time_list)
                        print("主播已下播")
                    else:
                        print("主播未上线")
                    break
                time.sleep(self.interval)
            # 3.绘制热度变化图并保存
            if len(self.hot_list)>0:
                self.plot_hot()
                self.hot_list = []
                self.time_list = []
            time.sleep(3600)


if __name__ == "__main__":
    area = input('请输入游戏区域:')
    name = input('请输入主播名字:')
    a = Douyu_Spider(area, name, 60)
    a.run()