基于R shiny的天气应用
简介
因为课程作业需要结合数据库进行一个小型网站应用的开发。开始想做一个股票分析应用的,然后,自己每周日花了点时间先做了一个天气应用的demo来熟悉相应开发流程。
在选择相应的开发工具时,想到了之前一直想了解,但没有去深入学习的R shiny框架,作为一个R语言的死粉,当然要紧跟着rstudio的脚步啦。
这里对R shiny做一个简单介绍,shiny是一个基于R语言的快速网站开发框架,对相应网站前后端高度封装,采用前后端分离技术

第一个强大之处在于高度封装,对于shiny应用,主要编写两个模块,ui模块与server模块,ui模块中的output类与server模块的render类进行相互的辅助达到相应的交互效果。
R shiny的另一个强大之处在于对原生网站开发工具的兼容性,在R shiny中可以使用jquery, vue, react等工具。
此外,相对于其他网站开发流程,R shiny app的部署相对便捷,shinyapps.io提供用户免费部署应用的服务,虽然拥有一些限制(应用个数等),但是无需申请租用服务器,若自己拥有服务器,则可在服务器上安装rstudio提供的shiny server。
好了,来谈谈我们的项目
使用的包
总所周知,R的包是非常强大的,这里我们采用下列包来搭建相应应用
library(shiny)
library(DT)
library(shinyWidgets)
library(rvest)
library(plyr)
library(shinymaterial)
library(shinyAce)
library(shiny)
library(ggplot2)
library(ggthemr)
library(shinythemes)
library(shinydashboard)
library(dashboardthemes)
library(shinycssloaders)
library(leaflet)
library(shinyjs)
library(weatherr)
library(RMySQL)
library(sweetalertR)
数据获取
因为是demo,所以没有将数据库加入我们的应用中,所有数据均从网页api中获取,这里采用网上的相应api访问代码,封装为相应函数。
fetchData <- function(city, date){

  baseUrl <- 'http://lishi.tianqi.com/'
  Url <- paste(baseUrl, city, '/', date, '.html', sep = '')

  content <- Url %>%
    read_html(encoding='GBK') %>%
    html_nodes('div.tqtongji2') %>%
    html_nodes("ul") %>%
    html_text() %>%
    strsplit("\\s{4,}")

  content <- ldply(content[-1])
  names(content) <- c('date', 'highDegree', 'lowDegree', 'weather', 'windDirection', 'windForce')
  return(content)
}
fetchData2 <- function(city, date){
  date <- paste(substring(date,first=0, last=4) , substring(date,first = 6,last = 7), sep ="")
  baseUrl <- 'http://lishi.tianqi.com/'
  Url <- paste(baseUrl, city, '/', date, '.html', sep = '')

  content <- Url %>%
    read_html(encoding='GBK') %>%
    html_nodes('div.tqtongji2') %>%
    html_nodes("ul") %>%
    html_text() %>%
    strsplit("\\s{4,}")

  content <- ldply(content[-1])
  names(content) <- c('date', 'highDegree', 'lowDegree', 'weather', 'windDirection', 'windForce')
  return(content)
}
fetchPredict <- function(mode)
{
  lng <- c(113.3244465713, 115.89, 116.46)
  lat <- c(23.1064679044, 28.68, 39.92)
  mode <- as.numeric(mode)
  print(mode)
  print(lng[mode])
  data <- locationforecast(lat[mode], lng[mode])
  return(data)
}
ui类编写
先上图吧


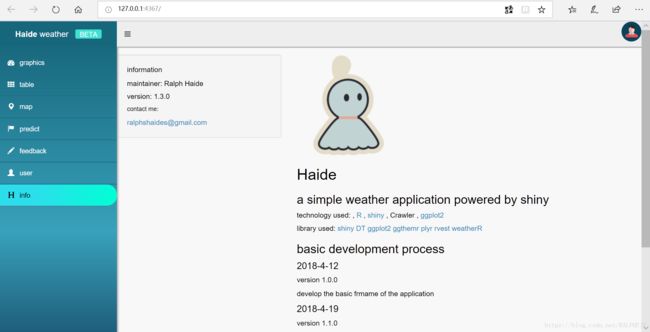

相应的有一些模块不满意就不展示了,虽然那个地图部分比较丑,暂时没有想到合理的布局来改善。
这里相应的ui部分代码如下
ui2 <- dashboardPage(

  dashboardHeader(
    #title="Haide"
    title = logo_blue_gradient,
    tags$li(class = "dropdown",
            uiOutput("S")

            #sweetalert(selector = "#Signin", text = "Signin", title = "world")


    )

    #actionButton("Go","Go")
  ),
  dashboardSidebar(
    sidebarMenu(
      menuItem("graphics", tabName = "graphics", icon = icon("dashboard")),
      menuItem("table", icon = icon("th"), tabName = "table"),
      menuItem("map", tabName = "map", icon = icon("map-marker",lib = "glyphicon")),
      menuItem("predict", icon = icon("flag",lib = "glyphicon"), tabName = "predict"),
      menuItem("feedback", tabName = "feedback", icon = icon("pencil",lib = "glyphicon")),
      menuItem("user",tabName = "user",icon = icon("user",lib = "glyphicon")),
      menuItem("info", icon = icon("header",lib = "glyphicon"), tabName = "info")
    )
  ),
  dashboardBody(
    #theme="style.css",
    shinyDashboardThemes(
      theme = "blue_gradient"
    ),
    includeCSS("www/style.css"),

    fluidRow(
      tabItems(
        tabItem(tabName = "graphics", sidebarLayout( position = "right", sidebarPanel( h4("select what you want here"), selectInput("select", h3("Select city"), choices = list("广州" = 'guangzhou', "南昌" = 'nanchang', "北京" = 'beijing'), selected = 2), dateInput("date", h3("Date input"), value = "2018-03-03"), selectInput("select_theme", h3("Select theme"), choices = list("dust" = "dust", "earth" = "earth","light" = "light", "pale" ="pale" , "fresh" = "fresh","chalk"="chalk","light"="light","sky"="sky","grass"="grass","grape"="grape"), selected = "fresh") ,bookmarkButton(id = "bookmark") ), mainPanel( plotOutput("plot_point")%>% withSpinner(type=4), plotOutput("plot_line")%>% withSpinner(type=4), plotOutput("plot_bar")%>% withSpinner(type=4) ) ) ),

        tabItem(tabName = "table", sidebarLayout( position = "right", sidebarPanel( h4("select what you want here"), selectInput("select2", h3("Select city"), choices = list("广州" = 'guangzhou', "南昌" = 'nanchang', "北京" = 'beijing'), selected = 2), dateInput("date2", h3("Date input"), value = "2018-03-03") ,downloadButton("downloadData", "Download"), checkboxGroupInput("show_vars", "Columns in tables to show:", c("date"="date","highDegree"="highDegree","lowDegree"="lowDegree", "weather"="weather","windDirection"="windDirection"), selected = c("date"="date","highDegree"="highDegree","lowDegree"="lowDegree", "weather"="weather","windDirection"="windDirection") )), mainPanel( DT::dataTableOutput('table')%>% withSpinner(type=4) ) ) ),
        tabItem(tabName = "map", sidebarPanel( h5("basic geo information"), textOutput("geo") ,h5("temparature now") ,textOutput("wea") ), mainPanel( leafletOutput("map")%>% withSpinner(type=4) ) ),

        tabItem(tabName = "predict", sidebarLayout( sidebarPanel( selectInput("select4", h3("Select city"), choices = list("广州" = 1, "南昌" = 2, "北京" = 3), selected = 2), checkboxGroupInput("show_vars2", "Columns in tables to show:", c("time"="time","temperature"="temperature","humidity"="humidity"),selected = c("time"="time","temperature"="temperature","humidity"="humidity")) ), mainPanel( DT::dataTableOutput('table4')%>% withSpinner(type=4) ) ) ),
        tabItem(tabName = "feedback", sidebarLayout( sidebarPanel( h5("Thanks for giving us valuable feedback"), actionButton("reset", "Reset text"), actionButton("submit", "submit"), material_button( input_id = "example_button", label = "BUTTON", depth = 10 ) ), mainPanel( aceEditor("ace",fontSize = 20,autoComplete = "enabled",theme="ambiance") ) ) ),
        tabItem(tabName = "user", uiOutput("user-info") ),
        tabItem(tabName = "info", sidebarLayout( sidebarPanel("information", h5("maintainer: Ralph Haide"), h5("version: 1.3.0"), h6("contact me:"), a("[email protected]") ), mainPanel( img(src="https://s1.ax1x.com/2018/04/15/CeieW6.png",width=200,height=200), br(), h2("Haide",aign="center"), h3("a simple weather application powered by shiny",align="left"), h5("technology used: ",",",a("R",href="https://www.r-project.org/"),",", a("shiny",href="http://shiny.rstudio.com/") ,",", "Crawler" ,",", a("ggplot2",href="http://ggplot2.org/")), h5("library used:", a("shiny",href="http://shiny.rstudio.com/") , a("DT"), a("ggplot2",href="http://ggplot2.org/"), a("ggthemr",href="https://cran.r-project.org/web/packages/ggthemes/index.html"), a("plyr",href="https://cran.r-project.org/web/packages/plyr/index.html"), a("rvest",href="https://cran.r-project.org/web/packages/rvest/index.html"),a("weatherR",href="https://cran.r-project.org/web/packages/weatherr/index.html")) ,includeMarkdown("log.md") ) ) )
      ))
  )
)
这里主要就是安排布局与相应的输入输出单元
server端编写
这里的server端主要处理网站的输出做逻辑规划,使用render类函数来对网站进行渲染。具体请查看相应文档。
server <- function(input, output,session) {

  output$selected_var <- renderText({
    paste("city selected: " , input$select, " ")
  })
  output$plot_point <- renderPlot({
    ggthemr(input$select_theme)
    name <- as.character(input$date)
    city <- input$select
    name <- paste(substring(name,first=0, last=4) , substring(name,first = 6,last = 7), sep ="")
    weatherData <- fetchData(city,name)
    len <- length(weatherData$date)
    ggplot(weatherData, aes(x=lowDegree, y=highDegree)) + geom_point()
  })
  output$plot_bar <- renderPlot({
    ggthemr(input$select_theme)
    name <- as.character(input$date)
    city <- input$select
    name <- paste(substring(name,first=0, last=4) , substring(name,first = 6,last = 7), sep ="")
    weatherData <- fetchData(city,name)
    len <- length(weatherData$date)
    day <- rep(seq(1, len),2)
    day <- day + 1
    degrees <- as.numeric(c(weatherData$lowDegree, weatherData$highDegre))
    tags <- rep(c("low","high"),each=len)
    data <- data.frame(day, degrees,tags)
    option = input$select_shape
    option = as.numeric(option)
    ggplot(data, aes(x = day, y = degrees , fill=tags)) +geom_bar(stat= 'identity', width = 0.5, position =  position_dodge(0.7))
  })
  output$plot_line <- renderPlot({
    ggthemr(input$select_theme)
    name <- as.character(input$date)
    city <- input$select
    name <- paste(substring(name,first=0, last=4) , substring(name,first = 6,last = 7), sep ="")
    weatherData <- fetchData(city,name)
    len <- length(weatherData$date)
    day <- rep(seq(1, len),2)
    day <- day + 1
    degrees <- as.numeric(c(weatherData$lowDegree, weatherData$highDegre))
    tags <- rep(c("low","high"),each=len)
    data <- data.frame(day, degrees,tags)
    option = input$select_shape
    option = as.numeric(option)
    ggplot(data, aes(x = day, y = degrees , color=tags)) + geom_point() + geom_line()
  })
  output$table <- DT::renderDataTable({
    fetchData2(input$select2,as.character(input$date2))[,input$show_vars, drop=FALSE]
  }
  )
  output$table4 <- DT::renderDataTable({
    fetchPredict(input$select4)[,input$show_vars2, drop=FALSE]
  }
  )
  output$downloadData <- downloadHandler(
    filename = function() {
      paste('data-', Sys.Date(), '.csv', sep='')
    },
    content = function(con) {
      data <- fetchData2(input$select2,as.character(input$date2))
      write.csv(data[,-1], con,row.names = TRUE)
    }
  )
  observeEvent(input$bookmark, {
    session$doBookmark()
  })

  output$map <- renderLeaflet({
    leaflet() %>%
      addTiles() %>%
      addMarkers(lng=115.89, lat=28.68,
                 popup="南昌",label = "南昌") %>%
      addMarkers(lng=113.3244465713,lat=23.1064679044,popup="广州",label = "广州") %>%
      addMarkers(lng=116.46,lat=39.92,popup="北京",label = "北京") %>%
      addMarkers(lng=114.30, lat=30.60,popup="武汉",label = "武汉")%>%addMiniMap()%>%addMeasure()


  })
  observeEvent(input$map_marker_click,{
    print("observed map_marker_click")
    p <- input$map_marker_click
    print(p)
    str <- paste(p$lat," , ",p$lng)
    print(str)
    output$geo <- renderText({
      str
    })
    output$wea <- renderText({
      data <- locationforecast(p$lat, p$lng)
      as.character(data$temperature[1])
    })
  })
  observeEvent(input$map_click,{
    print("observed map_marker_click")
    p <- input$map_click
    print(p)
    str <- paste(p$lat," , ",p$lng)
    print(str)
    output$geo <- renderText({
      str
    })
    output$wea <- renderText({
      data <- locationforecast(p$lat, p$lng)
      as.character(data$temperature[1])
    })
  }
  )
  observeEvent(input$reset, {
    updateAceEditor(session, "ace", value = "")

  })
  observeEvent(input$submit,{
    str = as.character(input$ace)
    print(str)
  })

  output$S <- renderUI({
    if (!s$signin){
      actionButton("Signin", "signin")
    }
    else{
      #actionButton("Signi", "Signi")
      img(src="user.png",width = 40, height = 40,align="left",id="user")
    }
  })
  observeEvent(input$Signin, {
    sendSweetAlert(
      session = session,
      title = "Success !!",
      text = "All in order",
      type = "success"
    )
    s$signin = TRUE
    #print(signin)
  })
  output$"user-info" <- renderUI({
    if (!s$signin){
      h3("you are not allowed to view this page before signin")
    }
    else{
      fluidRow(
        sidebarLayout(
          sidebarPanel(),
          mainPanel(
            valueBox(10 * 2, "New Orders", icon = icon("credit-card"))
          )
        )
      )

    }
  })
}
网站应用的运行与部署
若需要运行该应用,需要添加下面的一份代码
app <- shinyApp(ui = ui2, server = server)若希望将其部署到shinyapps.io,可以使用rstudio的相应publish功能,添加相应shinyapps.io账户,进行部署
此外
这里展示了部分代码,若需要查看完整代码,欢迎来fork该项目Haide
相应学习资源
- shiny官网
- shinytools