Python学习笔记#9:病毒传播模拟程序
文章目录
- 概述
- 方法1. 面向对象方式
- 1. 导入包
- 2. 全局参数
- 3. 定义人
- 4. 环境
- 5. 病毒感染
- 6. 动态显示
- 7. 结果
- 方法2. 矩阵运算方式
- 1. 代码
- 2. 重难点
- 3. 单点到多点的距离
概述
本章借助matplotlib包,模拟疫情传播,有两种思路:
- 使用面向对象的方式,每个人为一个独立对象
- 使用矩阵的方式
方法1. 面向对象方式
面向对象的方式,每个人为一个独立对象,算法:
- 遍历所有对象:
- 更新当前对象位置(移动)
- 计算当前对象到其他所有人的相对距离
- 根据距离,感染率等因素,改变对象邻居当前的状态。
算法逻辑非常简单,但是可以看到会嵌套多次循环,时间复杂度为: O ( n 2 ) O(n^2) O(n2)
1. 导入包
import numpy as np
import matplotlib.pyplot as plt
2. 全局参数
# 地图宽度
width = 100

# 总人口
pop = 2000

# 初始病人数量
n = 10

# 感染半径
sd = 10

# 感染几率 50%
sr = 0.5
3. 定义人
- 坐标:随机分布
- 颜色:绿色代表健康,红色代表感染
- 运动函数:人随机运动
# 人
class People(object):
    def __init__(self):
    	# 随机坐标
        self.x = np.random.rand() * width
        self.y = np.random.rand() * width
        self.loc = np.array([self.x, self.y])
        self.color = 'g'

    # 随机运动
    def move(self):
        self.x += np.random.randn()
        self.y += np.random.randn()
4. 环境
- 按照人口生成不同的人口对象
- 随机选择病源
# 人群
all_people = np.array([People() for i in range(pop)])

# 初始化患病人群
sick_people = np.random.choice(all_people, size=n, replace=False)
for p in sick_people:
    p.color = "r"
5. 病毒感染
- 遍历所有人群,区分患者与普通人
- 遍历患者:
- 遍历所有人,计算与当前患者的距离
- 当目标与患者距离小于传播半径,则有一定几率感染。
- 遍历所有人,计算与当前患者的距离
- 返回患病熟料
# 病毒感染函数
def affect(all_people):
    sick_people = []
    healthy_people = []
    n = 0
    for p in all_people:
        if p.color == "r":
            sick_people.append(p)
            n += 1
        if p.color == "g":
            healthy_people.append(p)

    for sp in sick_people:
        for hp in healthy_people:
            dist = np.linalg.norm(sp.loc - hp.loc)
            rad = np.random.rand()
            if hp.color == "g" and dist <= sd and rad < sr:
                hp.color = "r"
                n += 1
    return n
6. 动态显示
使用matplotlib互交模式,动态显示
plt.ion()

# 模拟
while n < pop:
    plt.clf()
    update(all_people)
    n = affect(all_people)
    plt.scatter([p.x for p in all_people], [p.y for p in all_people], c=[p.color for p in all_people], s=3)
    plt.axis([0, width, 0, width])
    plt.pause(0.5)
    print("总人数:{},传染人数:{}".format(pop, n))

plt.ioff()
plt.show()
7. 结果
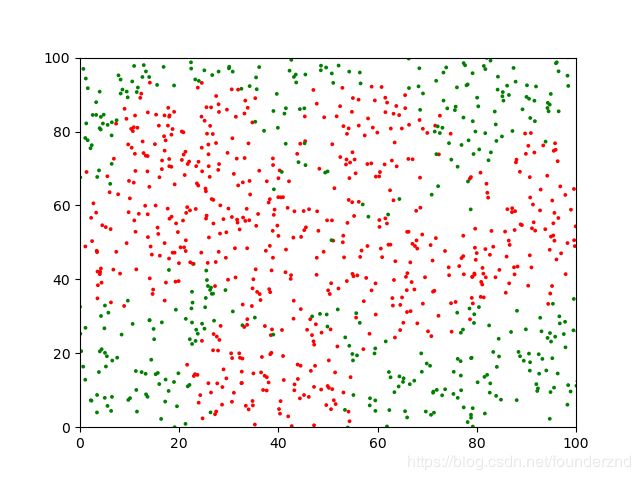

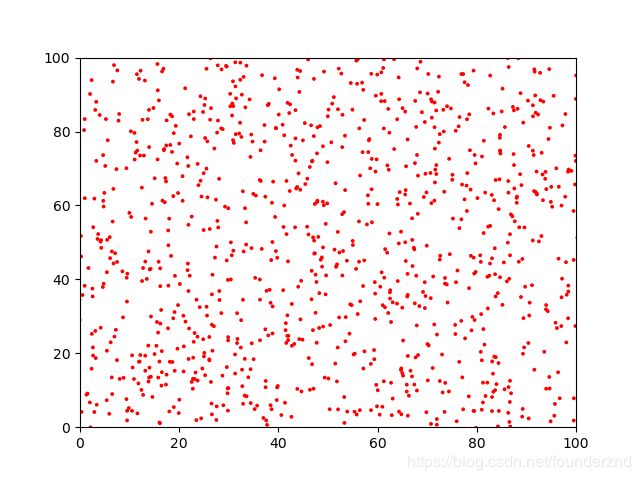
总人数:1000,传染人数:150
总人数:1000,传染人数:585
总人数:1000,传染人数:875
总人数:1000,传染人数:984
总人数:1000,传染人数:1000
方法2. 矩阵运算方式
借助numpy,可以非常快速的处理矩阵运算,特点:
- 速度快
- 处理数据量大
- 比较抽象
时间复杂度为: O ( n ) O(n) O(n)
1. 代码
import numpy as np
import matplotlib.pyplot as plt


class VirusSimulator(object):
    def __init__(self):

        # 地图宽度
        self.width = 100

        # 总人口
        self.pop = 5000

        # 初始病人数量
        self.first_patients = 10

        # 感染半径
        self.infection_radius = 5

        # 感染几率 50%
        self.infection_potential = 0.5

        # 人群:横坐标、纵坐标
        self.locations = np.random.randn(self.pop, 2) * self.width

        # 状态:(g-正常、r-感染)
        self.status = np.array(["g"] * self.pop)

        # 初始化感染群
        self.initPatients()

    # 更新人群位置
    def move(self):
        self.locations += np.random.randn(self.pop, 2)

    # 初始化患病人群
    def initPatients(self):
        for i in np.random.randint(self.pop, size=self.first_patients):
            if self.status[i] == "g":
                self.status[i] = "r"

    # 统计感染人群
    @property
    def patients(self):
        return self.locations[self.status == "r"]

    # 统计感染人数
    @property
    def patients_num(self):
        return self.status[self.status == "r"].size

    # 传染函数
    def affect(self):
        for ip in self.patients:
            distances = np.sqrt(np.sum(np.asarray(ip - self.locations)**2, axis=1))
            self.status[distances < self.infection_radius] = "r"

    # 显示函数
    def display(self):
        current_patient_num = self.patients_num
        print("总人数:{},传染人数:{}".format(self.pop, current_patient_num))
        plt.ion()

        while current_patient_num < self.pop:
            plt.clf()
            plt.scatter(self.locations[:, 0], self.locations[:, 1], c=self.status, s=1)
            plt.axis([-self.width, self.width, -self.width, self.width])
            self.move()
            self.affect()
            current_patient_num = self.patients_num
            print("总人数:{},传染人数:{}".format(self.pop, current_patient_num))
            plt.pause(0.5)

        plt.ioff()
        plt.show()


if __name__ == "__main__":
    vs = VirusSimulator()
    vs.display()
2. 重难点
运动
简单的生成一个随机向量矩阵,大小和原来的坐标矩阵一致,然后相加,即可达到随机运动的效果。
    # 更新人群位置
    def move(self):
        self.locations += np.random.randn(self.pop, 2)
装饰器
Python内置的@property装饰器就是负责把一个方法变成属性调用
    # 统计感染人群
    @property
    def patients(self):
        return self.locations[self.status == "r"]

    # 统计感染人数
    @property
    def patients_num(self):
        return self.status[self.status == "r"].size
感染函数
- 得到所有的感染者坐标
- 遍历感染者:
- 计算感染者与所有人的距离矩阵
distances - 计算传染概率矩阵
potential - 筛选小于传染距离的人员
k - 帅选达到传染几率的人员
b - 将所有小于传染范围并且达到传染几率
k * b的邻居标记为感染
- 计算感染者与所有人的距离矩阵
    # 传染函数
    def affect(self):
        for ip in self.patients:
            distances = np.sqrt(np.sum(np.asarray(ip - self.locations)**2, axis=1))
            potential = np.random.rand(self.pop)
            # 小于传染距离的矩阵
            k = distances < self.infection_radius
            # 达到传染几率的矩阵
            b = potential < self.infection_potential
            # 既小于传染距离又达到传染几率的人群
            self.status[k * b] = "r"
3. 单点到多点的距离
距离算法:
distances = np.sqrt(np.sum(np.asarray(ip - self.locations)**2, axis=1))
实际上可以分解为
l = np.asarray(ip - self.locations)
其中ip为单一的点,self.locations为数组,结果也为数组,大小和self.locations一样。
更进一步,得到每个点的差的乘积
l = np.asarray(ip - self.locations)**2
乘积相加,但是这样只有一个数字,
s = np.sum(np.array(ip - self.locations)**2)
想要得到矩阵,需要控制参数axis
# axis=1,表示沿着x轴相加,横向
l = np.sum(np.array(p - locations)**2,axis=1)

# axis=1,表示沿着y轴相加,竖向
l = np.sum(np.array(p - locations)**2,axis=0)
最后再对每一个元素开方,得到结果