Python中Matplotlib如何添加次坐标轴,添加多个图例
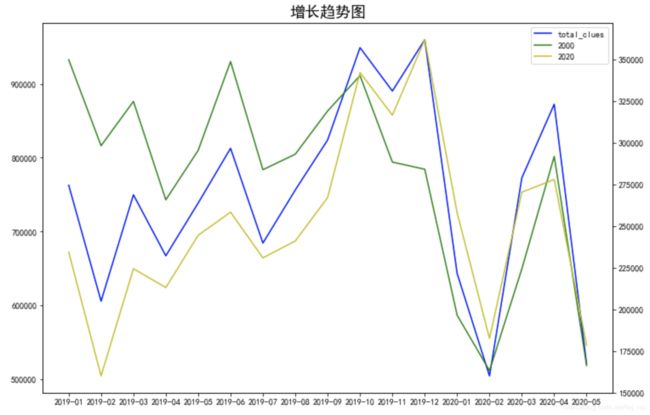
由于总量数据过大,不太适合与拆分的维度使用同一坐标轴展示,所以对于总量使用主坐标轴,拆分的细分维度均使用次坐标轴。
知识点1:subplots()
plt.subplots()可以创建一张画布和一系列的子图。可以返回画布对象matplotlib.figure.Figure,以及子图的坐标轴对象matplotlib.axes._subplots.AxesSubplot。
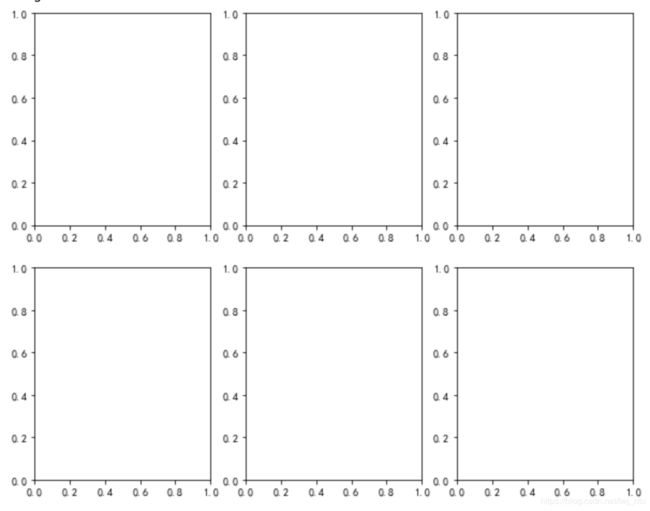
plt.subplots(2,3,figsize=(10,8))
画了一个画布,并且自动按照2行 * 3列拆分为6张子图。

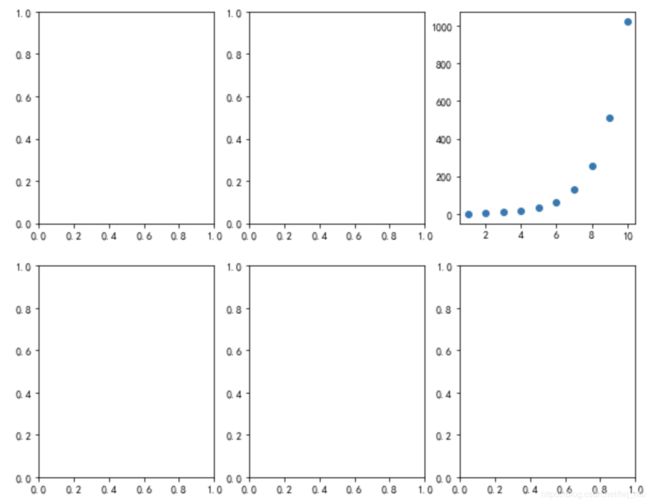
通过获取画图的返回值,可以在任意一张子图画图,比如我们在第3张子图上画一个以2为底的幂指数函数的散点图。
fig,((a1,a2,a3),(a4,a5,a6)) = plt.subplots(2,3,figsize=(10,8))
a3.scatter(x=[1,2,3,4,5,6,7,8,9,10],y=[1,4,8,16,32,64,128,256,512,1024])
Signature:
plt.subplots(
nrows=1,
ncols=1,
sharex=False,
sharey=False,
squeeze=True,
subplot_kw=None,
gridspec_kw=None,
**fig_kw,
)
Docstring:
Create a figure and a set of subplots.
This utility wrapper makes it convenient to create common layouts of
subplots, including the enclosing figure object, in a single call.
知识点2:twinx()
克隆了一个轴对象Axes,这个Axes对象与原始axes对象有相同的x轴,这个克隆对象的x轴是隐形的、不可见的;同时还会生成一个独立的、并与原始axes对象位置相对的,立于右侧的y轴。
Signature: ax.twinx()
Docstring:
Create a twin Axes sharing the xaxis.
Create a new Axes with an invisible x-axis and an independent
y-axis positioned opposite to the original one (i.e. at right). The
x-axis autoscale setting will be inherited from the original
Axes. To ensure that the tick marks of both y-axes align, see
~matplotlib.ticker.LinearLocator.
知识点3:legend()
3. Explicitly defining the elements in the legend
For full control of which artists have a legend entry, it is possible
to pass an iterable of legend artists followed by an iterable of
legend labels respectively::
legend((line1, line2, line3), (‘label1’, ‘label2’, ‘label3’))
legend()方法支持显性地定义图例中元素的内容,通过显性地传入图例实体参数、标签参数,就可以显示多个图例。
clues_by_month = clues_by_mt.groupby(['month']).sum()
x = np.array(clues_by_month.index.values)
y = np.array(clues_by_month['total_clues'].values)


clues_by_meit = clues_by_mt.groupby(['month','mt']).sum()
x1 = np.array(clues_by_meit.index.levels[0])
y1 = np.array(clues_by_meit['total_clues'].loc[:,'2000'])
y2 = np.array(clues_by_meit['total_clues'].loc[:,'2020'])

fig, ax = plt.subplots(figsize=(12,8))
ax1 = ax.twinx()

line1, = ax.plot(x,y,'b-')
line2, = ax1.plot(x,y1,'g-')
line3, = ax1.plot(x,y2,'y-')
plt.title("增长趋势图",fontdict={'fontsize':18})
plt.legend((line1,line2,line3),('total_clues','2000','2020'))


