时间序列分析案例 —— Rossmann 销售数据
文章目录
- 导入必要的包
- pandas 读取 csv
- 查看数据
- 数据增强,增加特征
- ECDF
- 缺失值分析
- 缺失值填补
- pandas 两表求交
- 商店类型与销量的关系
- 销售量和日期的关系
- 相关性分析
- 时间序列分析
- 季节性
- 年度趋势
- 自相关性
本文翻译自 kaggle 竞赛 Rossmann Store Sales 的一篇笔记,竞赛度主题是销量数据的预测,这里总结一些数据准备与分析方法
源码在:https://github.com/elena-petrova/rossmann_TSA_forecasts
翻译的目的是为了学习商业数据分析的一些套路,师夷长技以自强!
导入必要的包
numpy,pandas,matplotlib, seaborn,statsmodels
import warnings
warnings.filterwarnings("ignore")

# loading packages
# basic + dates
import numpy as np
import pandas as pd
from pandas import datetime

# data visualization
import matplotlib.pyplot as plt
import seaborn as sns # advanced vizs
%matplotlib inline

# statistics
from statsmodels.distributions.empirical_distribution import ECDF

# time series analysis
from statsmodels.tsa.seasonal import seasonal_decompose
from statsmodels.graphics.tsaplots import plot_acf, plot_pacf
pandas 读取 csv
# importing train data to learn
train = pd.read_csv("train.csv",
                    parse_dates = True, low_memory = False, index_col = 'Date')

# additional store data
store = pd.read_csv("store.csv",
                    low_memory = False)
这里可以了解一下参数:parse_dates,low_memory的作用哦
查看数据
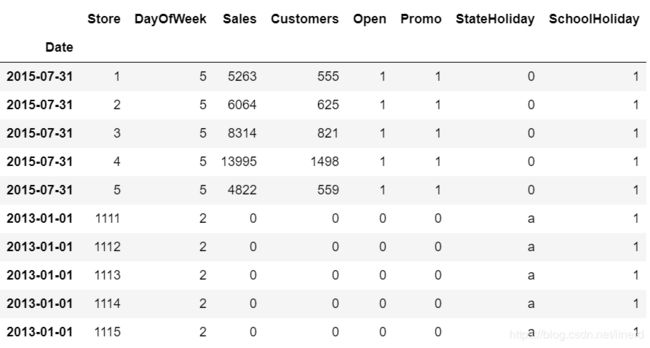
销售数据:1017209 行, 8 列
print("In total: ", train.shape)  # In total:  (1017209, 8)
train.head(5).append(train.tail(5))
- Sales:任意一天的营业额(目标变量)。
- Customers:给定日期的客户数量。
- Open:用于指示商店是否已开张营业:0 =关闭,1 =打开。
- Promo:指示商店当天是否在进行促销。
- StateHoliday:表示国家法定假日,通常商店都在州法定假日关闭。
- SchoolHoliday:指示(商店,日期)是否受到公立学校关闭的影响。
商铺数据:
# additional information about the stores
store.head()
- 商店:每个商店的唯一ID
- StoreType:区分4种不同的商店模型:a,b,c,d
- 分类:描述分类级别:a = 基本,b = 额外,c = 扩展
- CompetitionDistance:距最近的竞争对手商店的距离(以米为单位)
- CompetitionOpenSince [Month/Year]:给出最接近的竞争对手打开的时间的大约年份和月份
- Promo2:Promo2是某些商店的持续促销:0 = 商店不参与,1 = 商店正在参与
- Promo2Since [年/周]:描述商店开始参与Promo2的年份和日历周。
- PromoInterval:描述Promo2启动的连续间隔,并指定促销开始的月份。例如。 “二月,五月,八月,十一月”表示该商店的每一轮始于该年任何一年的二月,五月,八月,十一月
数据增强,增加特征
从日期中拆分特征
# data extraction
train['Year'] = train.index.year
train['Month'] = train.index.month
train['Day'] = train.index.day
train['WeekOfYear'] = train.index.weekofyear
增加新变量,描述客户的平均消费水平
# adding new variable
train['SalePerCustomer'] = train['Sales']/train['Customers']
train['SalePerCustomer'].describe()
'''
count    844340.000000
mean          9.493619
std           2.197494
min           0.000000
25%           7.895563
50%           9.250000
75%          10.899729
max          64.957854
Name: SalePerCustomer, dtype: float64
'''
顾客平均每天花费约9.50美元,尽管有几天的销售额等于零。
ECDF
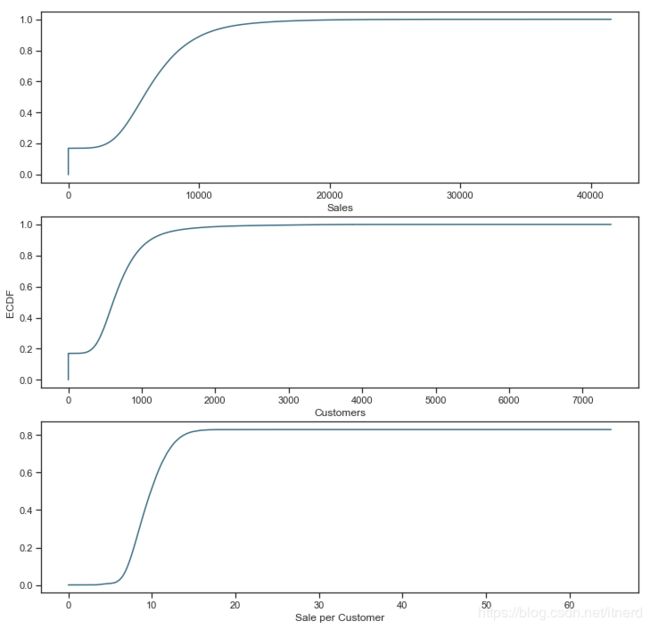
empirical cumulative distribution function,经验累计分布函数
为了获得关于数据中连续变量的第一印象,我们可以绘制ECDF
sns.set(style = "ticks")# to format into seaborn
c = '#386B7F' # basic color for plots
plt.figure(figsize = (12, 12))

plt.subplot(311)
cdf = ECDF(train['Sales'])
plt.plot(cdf.x, cdf.y, label = "statmodels", color = c)
plt.xlabel('Sales')

# plot second ECDF
plt.subplot(312)
cdf = ECDF(train['Customers'])
plt.plot(cdf.x, cdf.y, label = "statmodels", color = c)
plt.xlabel('Customers')
plt.ylabel('ECDF')

# plot second ECDF
plt.subplot(313)
cdf = ECDF(train['SalePerCustomer'])
plt.plot(cdf.x, cdf.y, label = "statmodels", color = c)
plt.xlabel('Sale per Customer')
累积分布函数是概率密度函数的积分,所以CDF变化越快的地方概率密度越大!
此外还可以分析出:
- 大约有 20% 的数据需要我们处理的销量和客户数量为零
- 而几乎 80% 的时间每天的销售数量少于1000
- 等等
缺失值分析
来分析店门关闭且营业额为零的样本
# closed stores
train[(train.Open == 0) & (train.Sales == 0)].head()
len(train[(train.Open == 0) & (train.Sales == 0)]) # 172817
店铺关闭且销量为零的样本占总数的 172817 1017209 ≃ 17 % \frac{172817}{1017209} \simeq 17\% 1017209172817≃17%
因为 kaggle 竞赛的主题是预测未来销量,这些零值对预测趋势是无益的,所以在预处理时直接舍弃掉
下面看看店铺开张但销量为零的样本数
# opened stores with zero sales
zero_sales = train[(train.Open != 0) & (train.Sales == 0)]
print("In total: ", zero_sales.shape)  # (54, 13)
zero_sales.head(5)

有趣的是,这些商店在工作日开了却没有销售,数据中只有54个样本
商铺数据的缺失值:
# missing values?
store.isnull().sum()
'''
Store                          0
StoreType                      0
Assortment                     0
CompetitionDistance            3
CompetitionOpenSinceMonth    354
CompetitionOpenSinceYear     354
Promo2                         0
Promo2SinceWeek              544
Promo2SinceYear              544
PromoInterval                544
dtype: int64
'''
缺失值填补
先处理一下 CompetitionDistance
# missing values in CompetitionDistance
store[pd.isnull(store.CompetitionDistance)]

显然,该信息只是从数据中丢失了。在这种情况下,用中位数(比平均值小两倍)替换 NaN 是完全有意义的。
# fill NaN with a median value (skewed distribuion)
store['CompetitionDistance'].fillna(store['CompetitionDistance'].median(), inplace = True)
如果你是个暴躁老哥,那就
# replace NA's by 0
store.fillna(0, inplace = True)
pandas 两表求交
只有那些有店铺信息的销售数据才做分析
pd.merge(train, store, how = 'inner', on = 'Store')
print("Joining train set with an additional store information.")

# by specifying inner join we make sure that only those observations
# that are present in both train and store sets are merged together
train_store = pd.merge(train, store, how = 'inner', on = 'Store')

print("In total: ", train_store.shape)
train_store.head()
商店类型与销量的关系
train_store.groupby('StoreType')['Sales'].describe()

在所有其他类型中,StoreType B的Sales平均值最高,但是数据要少得多。
因此,让我们打印销售和客户的总和,以查看哪种StoreType是最畅销和最拥挤的:
train_store.groupby('StoreType')['Customers', 'Sales'].sum()
销售量和日期的关系
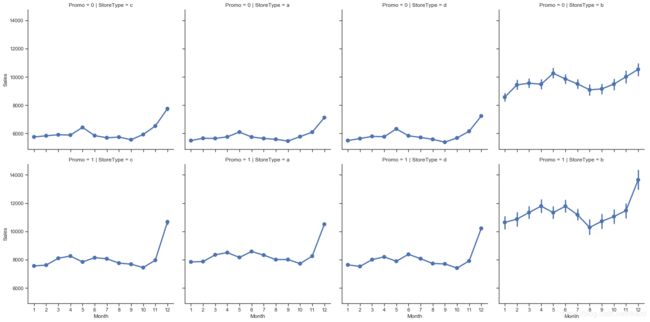
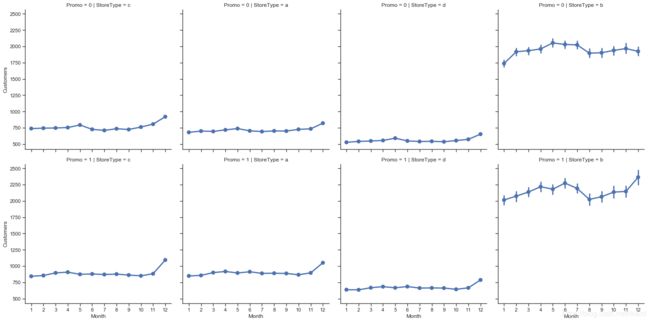
Seaborn的facet grid是完成此任务的最佳工具:
sns.factorplot(data = train_store,
               x = 'Month',
               y = 'Sales',
               col = 'StoreType', # per store type in cols
               row = 'Promo', # per promo in the store in rows
               )
sns.factorplot(data = train_store, x = 'Month', y = "Customers",
               col = 'StoreType', # per store type in cols
               row = 'Promo'# per promo in the store in rows
              )
# sale per customer trends
sns.factorplot(data = train_store, x = 'Month', y = "SalePerCustomer",
               col = 'StoreType', # per store type in cols
               row = 'Promo'# per promo in the store in rows
              )
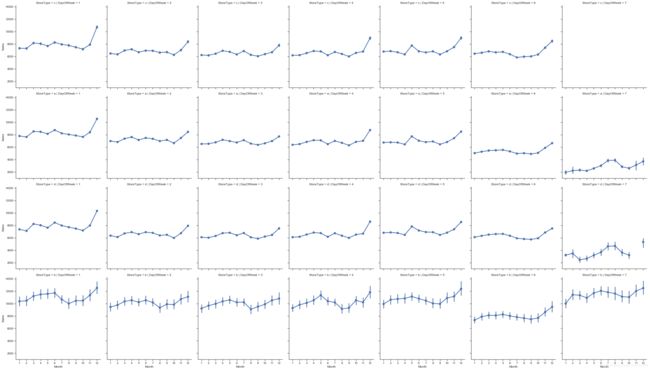
sns.factorplot(data = train_store, x = 'Month', y = "Sales",
               col = 'DayOfWeek', # per store type in cols
               row = 'StoreType', # per store type in rows
              )
筛选出周日不开门的店铺
# stores which are opened on Sundays
train_store[(train_store.Open == 1) & (train_store.DayOfWeek == 7)]['Store'].unique()
总体来看,以上曲线都反映出销量数据在 12 月达到峰值,大概都在买年货准备过圣诞吧 ♂️
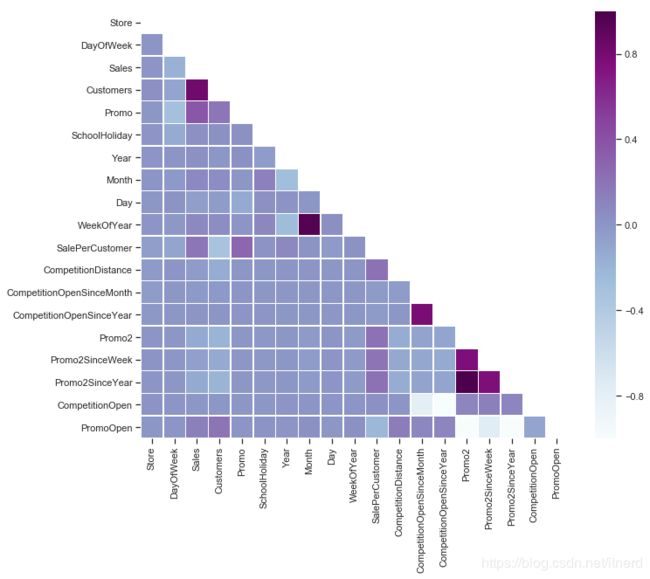
相关性分析
# Compute the correlation matrix
# exclude 'Open' variable
corr_all = train_store.drop('Open', axis = 1).corr()

# Generate a mask for the upper triangle
mask = np.zeros_like(corr_all, dtype = np.bool)
mask[np.triu_indices_from(mask)] = True

# Set up the matplotlib figure
f, ax = plt.subplots(figsize = (11, 9))

# Draw the heatmap with the mask and correct aspect ratio
sns.heatmap(corr_all, mask = mask,
            square = True, linewidths = .5, ax = ax, cmap = "BuPu")
plt.show()
时间序列分析
是什么使时间序列不同于常规回归问题? 它是时间相关的。
在这种情况下,观测值是独立的线性回归的基本假设不成立。
随着趋势的增加或减少,大多数时间序列都有某种形式的季节性趋势,即特定时间范围的变化。例如,在此数据集中呈现出每年圣诞节期间的销量增长。
季节性
我们从商店类型中选取四个商店来代表他们的组:
- StoreType A的商店编号2
- StoreType B的商店编号85,
- StoreType C的商店编号1
- StoreType D的商店编号13。
使用重采样方法将数据从以天为单位减少到以周为单位也是有意义的,以便更清楚地看到当前趋势。
# preparation: input should be float type
train['Sales'] = train['Sales'] * 1.0

# store types
sales_a = train[train.Store == 2]['Sales']
sales_b = train[train.Store == 85]['Sales'].sort_index(ascending = True) # solve the reverse order
sales_c = train[train.Store == 1]['Sales']
sales_d = train[train.Store == 13]['Sales']

f, (ax1, ax2, ax3, ax4) = plt.subplots(4, figsize = (12, 13))

# store types
sales_a.resample('W').sum().plot(color = c, ax = ax1)
sales_b.resample('W').sum().plot(color = c, ax = ax2)
sales_c.resample('W').sum().plot(color = c, ax = ax3)
sales_d.resample('W').sum().plot(color = c, ax = ax4)
我们可能已经看到 D 的趋势相同,但是在2014年7月至2015年1月期间,没有这些商店的信息,因为他们关闭了。
年度趋势
f, (ax1, ax2, ax3, ax4) = plt.subplots(4, figsize = (12, 13))

# monthly
decomposition_a = seasonal_decompose(sales_a, model = 'additive', freq = 365)
decomposition_a.trend.plot(color = c, ax = ax1)

decomposition_b = seasonal_decompose(sales_b, model = 'additive', freq = 365)
decomposition_b.trend.plot(color = c, ax = ax2)

decomposition_c = seasonal_decompose(sales_c, model = 'additive', freq = 365)
decomposition_c.trend.plot(color = c, ax = ax3)

decomposition_d = seasonal_decompose(sales_d, model = 'additive', freq = 365)
decomposition_d.trend.plot(color = c, ax = ax4)
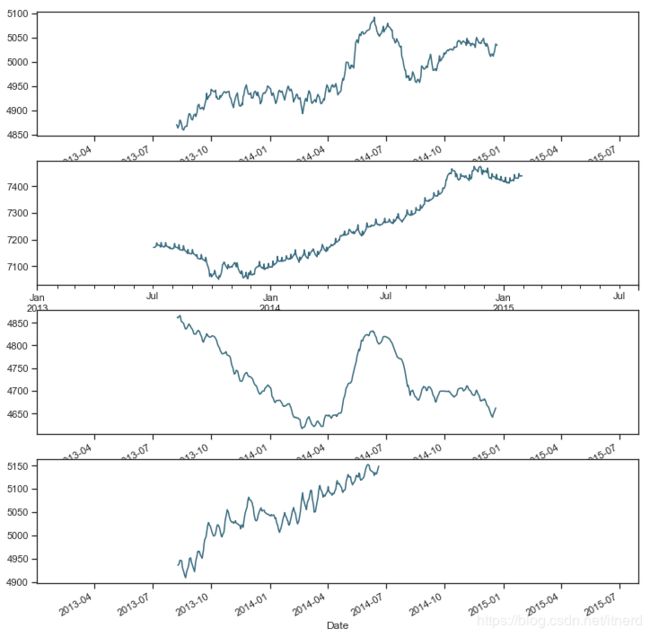
总体销售额似乎有所增长,但 C 却没有增长。尽管 A是数据集中最畅销的商店类型,但它似乎遵循与 C 相同的递减轨迹。
自相关性
下一步是检查自相关函数(ACF)和部分自相关函数(PACF)图。
ACF 是时间序列与自身滞后版本之间的相关性度量。例如,滞后5步,ACF会将 “ t 1 ” … “ t n ” “ t_1”…“ t_n” “t1”…“tn”时刻的序列与 “ t − 4 ” … … “ t n − 5 ” “ t_{-4}”……“ t_{n-5}” “t−4”……“tn−5”时刻的序列进行比较。
PACF 也会测量时间序列与其自身的滞后版本之间的相关性,但要消除中间变量的影响。
# figure for subplots
plt.figure(figsize = (12, 8))

# acf and pacf for A
plt.subplot(421); plot_acf(sales_a, lags = 50, ax = plt.gca(), color = c)
plt.subplot(422); plot_pacf(sales_a, lags = 50, ax = plt.gca(), color = c)

# acf and pacf for B
plt.subplot(423); plot_acf(sales_b, lags = 50, ax = plt.gca(), color = c)
plt.subplot(424); plot_pacf(sales_b, lags = 50, ax = plt.gca(), color = c)

# acf and pacf for C
plt.subplot(425); plot_acf(sales_c, lags = 50, ax = plt.gca(), color = c)
plt.subplot(426); plot_pacf(sales_c, lags = 50, ax = plt.gca(), color = c)

# acf and pacf for D
plt.subplot(427); plot_acf(sales_d, lags = 50, ax = plt.gca(), color = c)
plt.subplot(428); plot_pacf(sales_d, lags = 50, ax = plt.gca(), color = c)

plt.show()

每个水平对都是一个类型的商店。这些图显示了序列与自身x个时间单位滞后的相关性。
每对图有两个共同点:
- 时间序列的非随机数
- 与单步滞后序列有很强的的相关性。
A型和B型均显示出一定滞后性的季节性:对于类型A,在12(s)和24(2s) 步滞后出具有正的尖峰,说明以12为季节长度。对于B型,这是以周为周期,在7,14,21和28滞后处出现正峰值。
C型和D型的图更为复杂,每个观察都与其相邻的观察强相关。
