MATLAB学习笔记 彩色变换
MATLAB学习笔记 彩色变换
interp1q(x, y, xi) 线性内插,获得xi点的yi值(直线)
x 为列向量 设置x轴各个点
y 为列向量 设置y轴的各个点
xi 为列向量,代表取xi的位置的值
z = interp1q([0 10]', [0 5]', [0 1 2]') % 返回[0; 0.5; 1.0]spline(x, y, xi) 三次样条内插, 获得xi的yi值(曲线)
z = spline([0:2]', [0:4]', [0:3]') % 返回[1; 2; 3; 15]ice(‘p’, ‘v’, …) 交互颜色编辑
ice(‘image’, f) 显示图像编辑
f = imread('coins.png');
g = ice('image', f);- 输入:

- 输出:
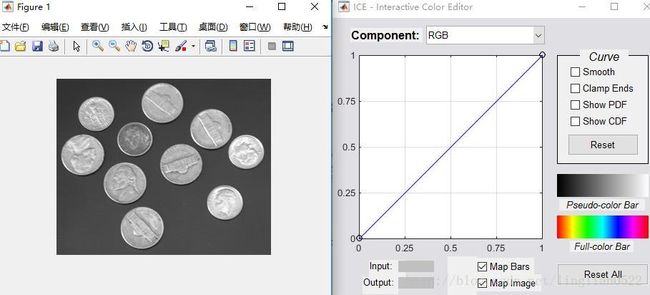
ice(‘image’, f, ‘wait’, ‘off’) 如果wait为off 会立即释放控制,为on则锁定控制
g = ice('image', f, 'wait', 'off');
h = get(g);
h.Name- 输入:

- 输出:

ice 窗口操作
| 鼠标操作 | 结果 |
|---|---|
| 左键 | 按住并拖动来移动控制点 |
| 左键+Shift键 | 添加控制点。拖动(同时按住Shift键)可改变控制点的位置 |
| 左键+Control键 | 删除控制点 |
鼠标左键代表移动, 鼠标中键代表添加, 右键代表删除
| GUI元素 | 描述 |
|---|---|
| Smooth | 选择则使用三次样条内插 |
| Clamp Ends | 选择则强制将三次样条的起始和结束曲线斜度设置为0 |
| Show PDF | 显示被映射函数影响的图像分量的概率密度函数(即直方图) |
| Show CDF | 显示累计分布函数并非PDF(注意,PDF和CDF不能同时显示 |
| Map Image | 选中则启动图像映射,默认选中 |
| Map Bars | 选择则启动伪彩色和全彩色条带映射 |
| Reset | 重置 |
| Reset All | 重置所有 |
| Input/Output | 显示坐标,Input为x轴,Output为y轴 |
| Component | 为交互操作选择一个映射函数,就是选择图片的哪个分量进行操作 |
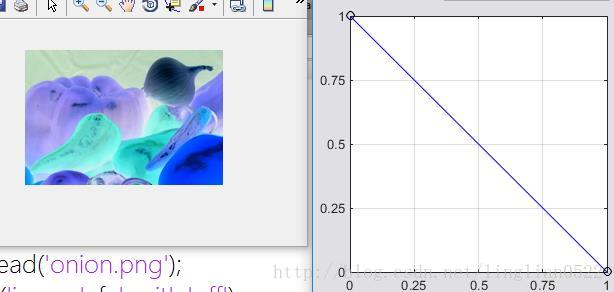
单色负片和彩色分量的反映射
% 单色
f = imread('coins.png');
g = ice('image', f, 'wait', 'off');- 输入:

- 输出:
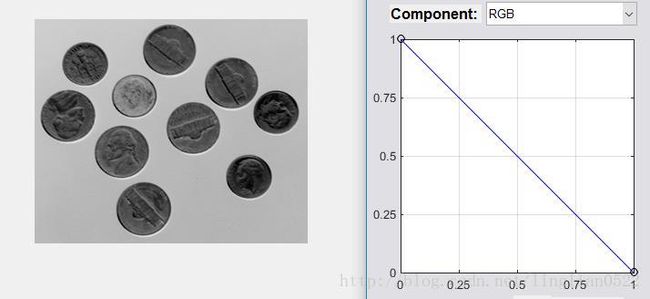
% 彩色
f = imread('onion.png');
g = ice('image', f, 'wait', 'off');- 输入:

- 输出:
单色和彩色对比度增强
- 输入输出:
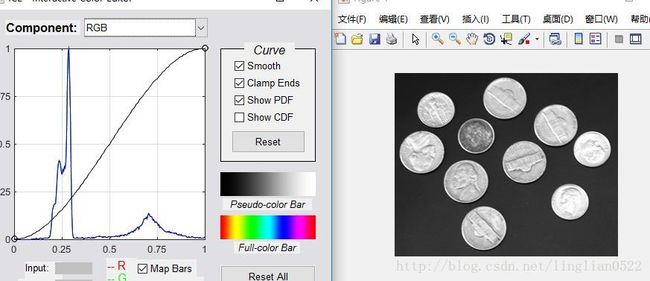
- 输入输出:
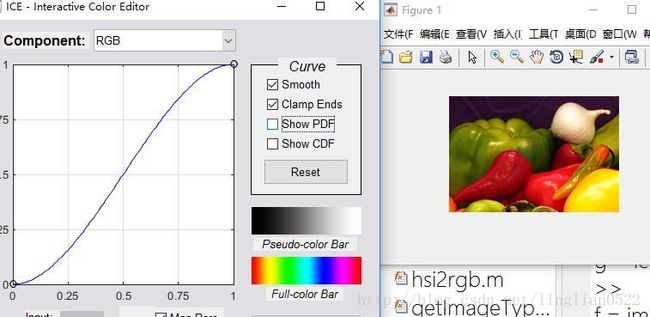
伪彩色映射
f = imread('img2.tif');
g = ice('image', f);- 输入:
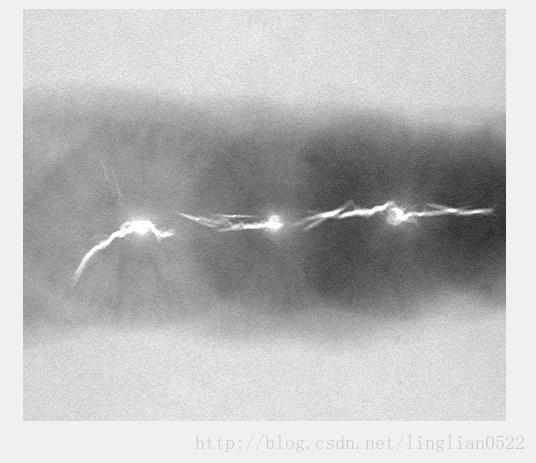
- 输出:
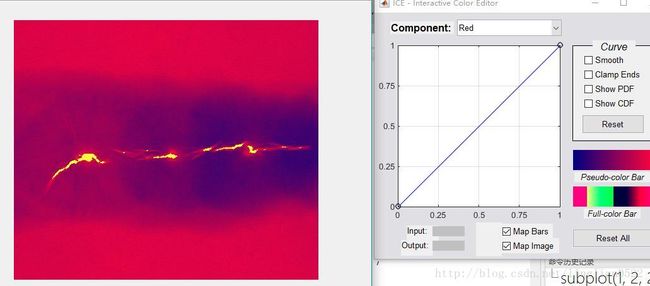
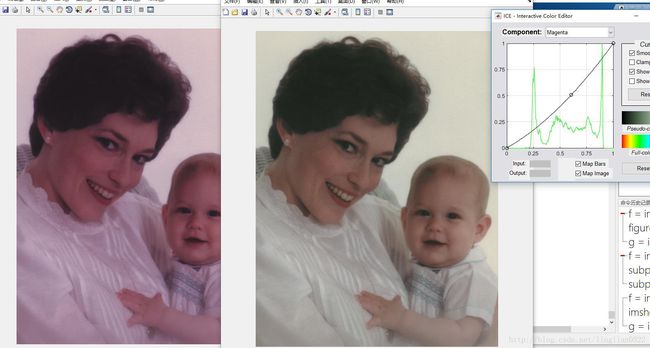
彩色平衡
f = imread('mb.tif');
imshow(f);
g = ice('image', f, 'space', 'CMY');- 输入:

- 输出:
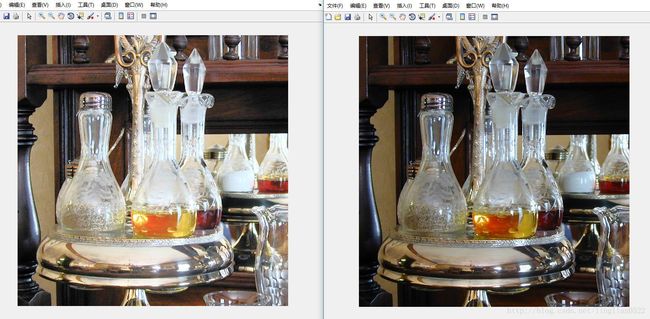
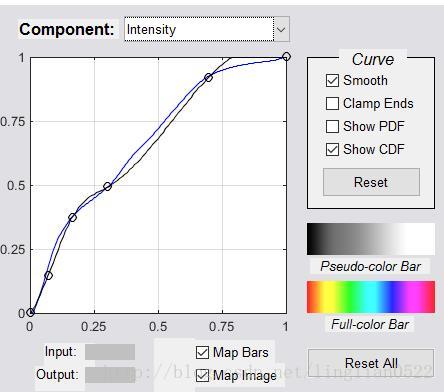
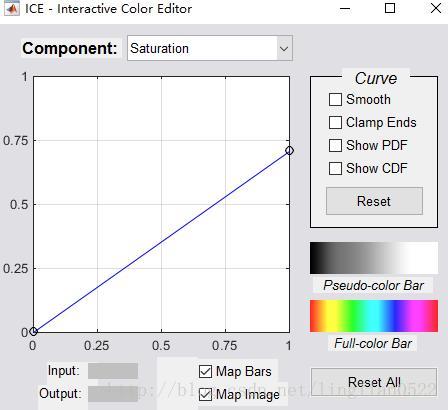
基于直方图的映射
f = imread('img3.tif');
imshow(f);
g = ice('image', f, 'space', 'hsi');- 输入:

- 输出:
彩色图像的空间滤波
彩色图像平滑
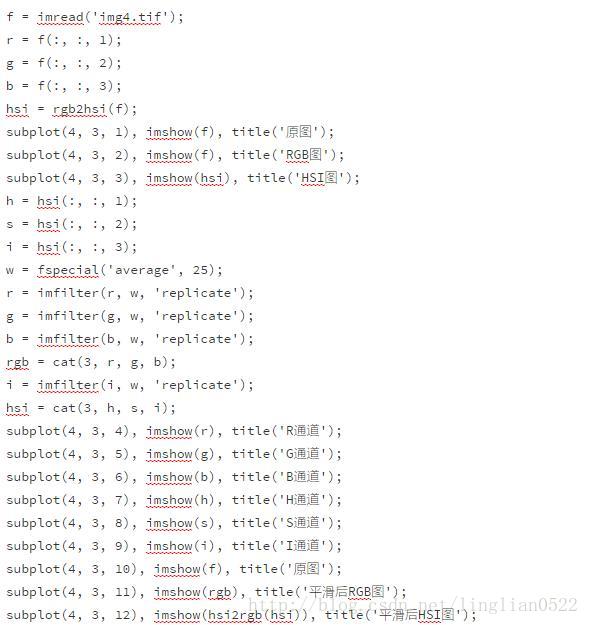
分别对RGB通道三分量进行平滑,对HSI的I通道进行平滑
 f = imread('img4.tif');
 r = f(:, :, 1);
 g = f(:, :, 2);
 b = f(:, :, 3);
 hsi = rgb2hsi(f);
 subplot(4, 3, 1), imshow(f), title('原图');
 subplot(4, 3, 2), imshow(f), title('RGB图');
 subplot(4, 3, 3), imshow(hsi), title('HSI图');
 h = hsi(:, :, 1);
 s = hsi(:, :, 2);
 i = hsi(:, :, 3);
 w = fspecial('average', 25);
 r = imfilter(r, w, 'replicate');
 g = imfilter(g, w, 'replicate');
 b = imfilter(b, w, 'replicate');
 rgb = cat(3, r, g, b);
 i = imfilter(i, w, 'replicate');
 hsi = cat(3, h, s, i);
 subplot(4, 3, 4), imshow(r), title('R通道');
 subplot(4, 3, 5), imshow(g), title('G通道');
 subplot(4, 3, 6), imshow(b), title('B通道');
 subplot(4, 3, 7), imshow(h), title('H通道');
 subplot(4, 3, 8), imshow(s), title('S通道');
 subplot(4, 3, 9), imshow(i), title('I通道');
 subplot(4, 3, 10), imshow(f), title('原图');
 subplot(4, 3, 11), imshow(rgb), title('平滑后RGB图');
subplot(4, 3, 12), imshow(hsi2rgb(hsi)), title('平滑后HSI图');- 输入:
- 输出:
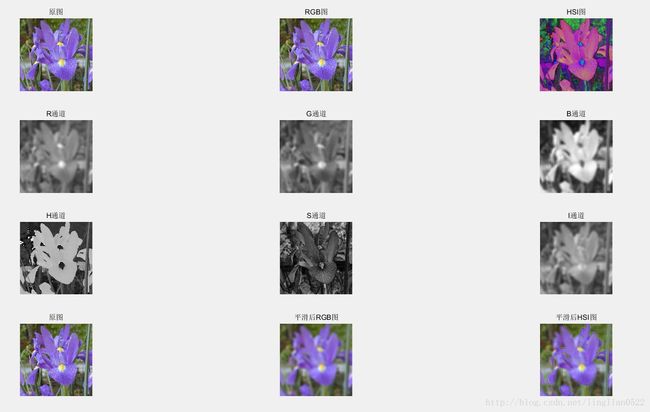
彩色图像锐化
f = imread('img4.tif');
g = tofloat(f);
la = [1 1 1; 1 -8 1; 1 1 1];
subplot(1, 2, 1), imshow(f), title('原图');
subplot(1, 2, 2), imshow(g - imfilter(g, la, 'replicate')), title('锐化后');- 输入:

- 输出:
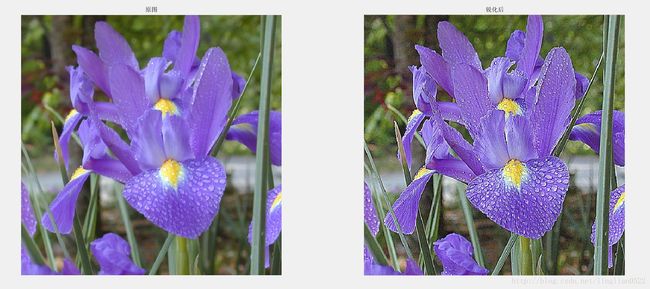
直接在RGB向量空间的处理
利用梯度进行彩色边缘检测
colorgrad(image, T) 可以用来检测RGB图像的边缘
还可以设置T用来将一些边缘消除
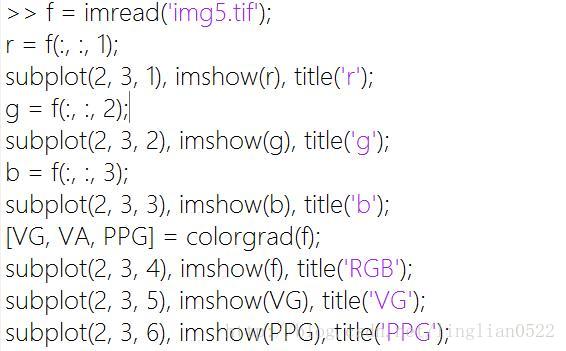
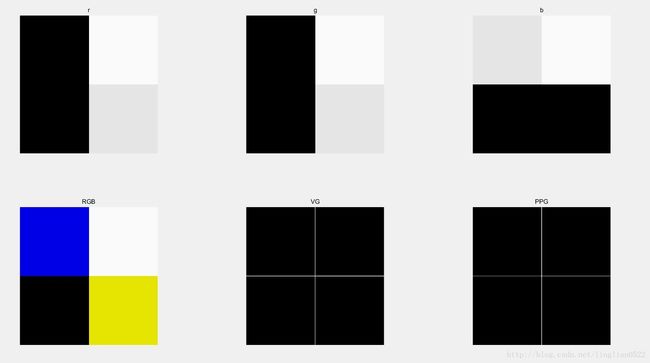
f = imread('img5.tif');
r = f(:, :, 1);
subplot(2, 3, 1), imshow(r), title('r');
g = f(:, :, 2);
subplot(2, 3, 2), imshow(g), title('g');
b = f(:, :, 3);
subplot(2, 3, 3), imshow(b), title('b');
[VG, VA, PPG] = colorgrad(f);
subplot(2, 3, 4), imshow(f), title('RGB');
subplot(2, 3, 5), imshow(VG), title('VG');
subplot(2, 3, 6), imshow(PPG), title('PPG');- 输入:
- 输出:
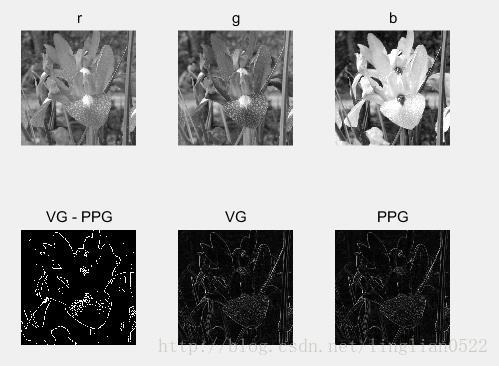
获得彩图的边缘
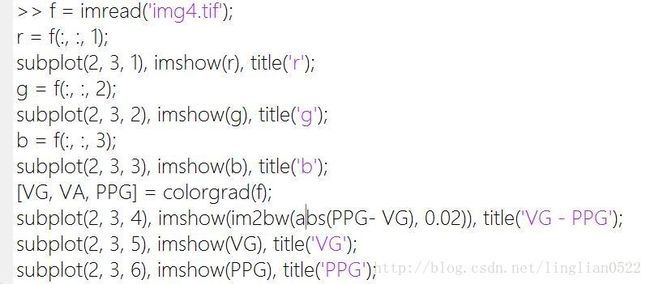
f = imread('img4.tif');
r = f(:, :, 1);
subplot(2, 3, 1), imshow(r), title('r');
g = f(:, :, 2);
subplot(2, 3, 2), imshow(g), title('g');
b = f(:, :, 3);
subplot(2, 3, 3), imshow(b), title('b');
[VG, VA, PPG] = colorgrad(f);
subplot(2, 3, 4), imshow(im2bw(abs(PPG- VG), 0.02)), title('VG - PPG');
subplot(2, 3, 5), imshow(VG), title('VG');
subplot(2, 3, 6), imshow(PPG), title('PPG');- 输入:
- 输出:
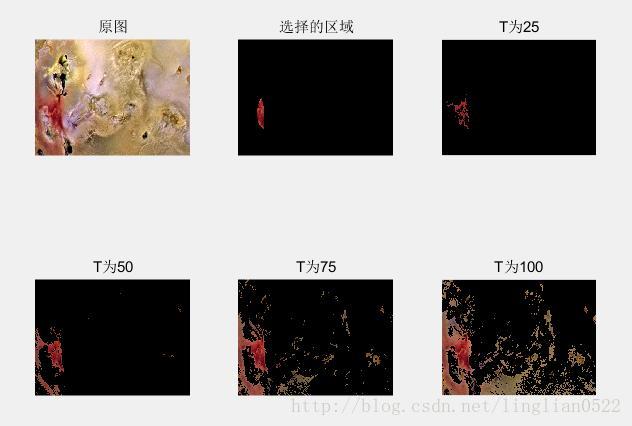
在RGB向量空间中进行图像分割
colorseg(method, f, T, parameters)图像分割
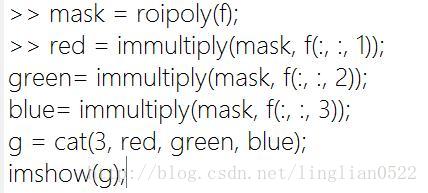
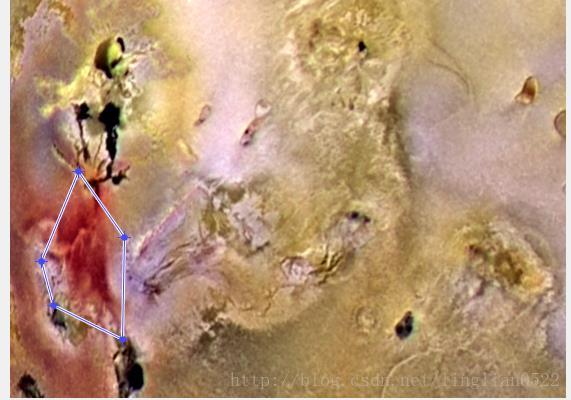
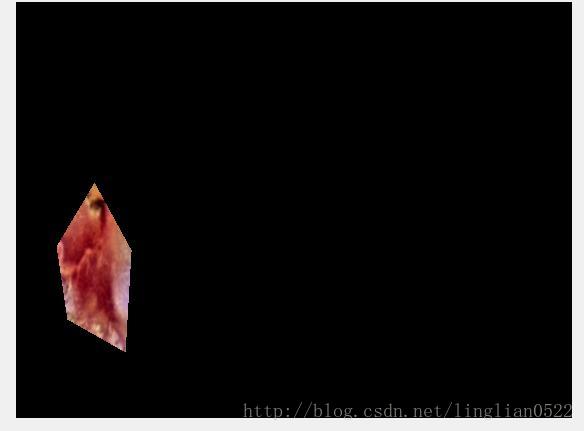
先获取一块区域
f = imread('img6.tif');
mask = roipoly(f);
red = immultiply(mask, f(:, :, 1));
green= immultiply(mask, f(:, :, 2));
blue= immultiply(mask, f(:, :, 3));
g = cat(3, red, green, blue);
imshow(g);- 输入:
- 输出:
接下来计算三个分量的标准差
[M, N, K] = size(g);
I = reshape(g, M * N, 3);
idx = find(mask);
I = double(I(idx, 1:3));
[C, m] = covmatrix(I);
d = diag(C);
sd = sqrt(d)
接着使用colorseg进行图像精准分割
欧式距离(euclidean)
马氏距离()
f = imread('img6.tif');
mask = roipoly(f);
red = immultiply(mask, f(:, :, 1));
green= immultiply(mask, f(:, :, 2));
blue= immultiply(mask, f(:, :, 3));
g = cat(3, red, green, blue);
imshow(g);
[M, N, K] = size(g);
I = reshape(g, M * N, 3);
idx = find(mask);
I = double(I(idx, 1:3));
[C, m] = covmatrix(I);
d = diag(C);
sd = sqrt(d)
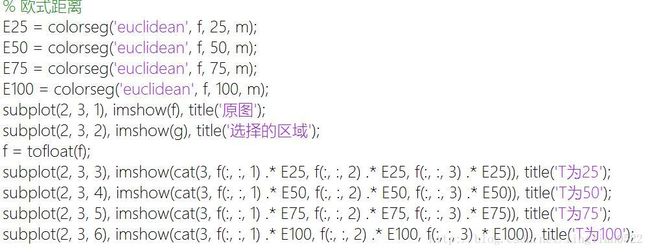
% 欧式距离
E25 = colorseg('euclidean', f, 25, m);
E50 = colorseg('euclidean', f, 50, m);
E75 = colorseg('euclidean', f, 75, m);
E100 = colorseg('euclidean', f, 100, m);
subplot(2, 3, 1), imshow(f), title('原图');
subplot(2, 3, 2), imshow(g), title('选择的区域');
f = tofloat(f);
subplot(2, 3, 3), imshow(cat(3, f(:, :, 1) .* E25, f(:, :, 2) .* E25, f(:, :, 3) .* E25)), title('T为25');
subplot(2, 3, 4), imshow(cat(3, f(:, :, 1) .* E50, f(:, :, 2) .* E50, f(:, :, 3) .* E50)), title('T为50');
subplot(2, 3, 5), imshow(cat(3, f(:, :, 1) .* E75, f(:, :, 2) .* E75, f(:, :, 3) .* E75)), title('T为75');
subplot(2, 3, 6), imshow(cat(3, f(:, :, 1) .* E100, f(:, :, 2) .* E100, f(:, :, 3) .* E100)), title('T为100');- 输入:
- 输出:
