使用pyqtgraph模块进行PyQt绘图(2)
将pyqtgraph作为窗体嵌入到PyQt程序中
总体使用原则:可以用其他的widget一样的使用方式使用pyqtgraph
基础使用方法之PlotWidget类
基础类之一 pyqtgraph.PlotWidget
这个类是用来绘图的基础控件
# 类定义
class pyqtgraph.PlotWidget(parent=None, background='default', **kargs)
# 初始化的时候,parent和background参数会被传递给 GraphsWidget.__init__()
# 其他参数会被传递给 PlotItem.__init__()

# 方法--获取控件中包含的 PlotItem 对象
getPlotItem()

sigTransformChanged
# GraphicsView widget with a single PlotItem inside.
"""
The following methods are wrapped directly from PlotItem: addItem, removeItem, clear, setXRange, setYRange, setRange, autoRange, setXLink, setYLink, viewRect, setMouseEnabled, enableAutoRange, disableAutoRange, setAspectLocked, setLimits, register, unregister
For all other methods, use getPlotItem.
"""
实例测试:在QMainWindow中添加PlotWidget控件
基础测试
源码:
from PyQt5.QtWidgets import QApplication, QPushButton, QVBoxLayout, QMainWindow, QWidget
import pyqtgraph as pg
import numpy as np
import sys


class TestWindow(QMainWindow):
    def __init__(self, parent=None):
        QMainWindow.__init__(self)
        # 设置窗体尺寸
        self.setGeometry(300, 300, 500, 350)
        # 添加一个按钮和一个PlotWidget
        self.draw_fig_btn = QPushButton("绘图")
        self.draw_fig_btn.setFixedWidth(100)
        self.plt = pg.PlotWidget()
        # 将两个Widget垂直排列布局
        # MainWindow的主体内容要通过一个widget包裹在一起,通过self.setCentralWidget设置
        centralWidget = QWidget()
        main_layout = QVBoxLayout()
        main_layout.addWidget(self.draw_fig_btn)
        main_layout.addWidget(self.plt)
        centralWidget.setLayout(main_layout)
        # 应用上述布局
        self.setCentralWidget(centralWidget)
        # 为[绘图]按钮注册一个回调函数
        self.draw_fig_btn.clicked.connect(self.draw_fig_btn_cb)

    def draw_fig_btn_cb(self):
        # [绘图]按钮回调函数
        x = np.linspace(-5 * np.pi, 5 * np.pi, 500)
        y = 0.5 * np.sin(x)
        self.plt.plot(x, y, pen="r")


if __name__ == "__main__":
    app = QApplication(sys.argv)
    qb = TestWindow()
    qb.show()
    sys.exit(app.exec_())
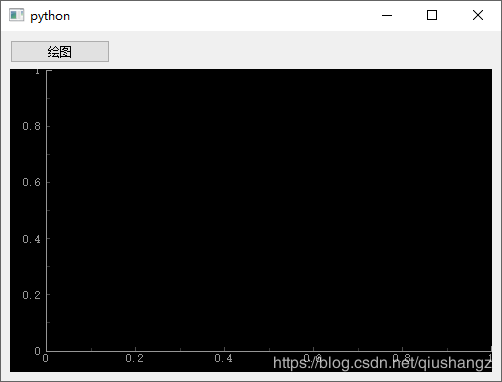
初始窗体:
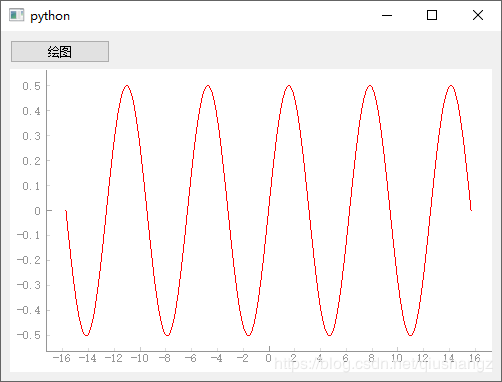
单击绘图按键以后:

改变绘图背景颜色
全局设置
在程序最开头 import的后面加入以下语句
设置背景为白色,前景为黑色
pg.setConfigOption('background', 'w')
pg.setConfigOption('foreground', 'k')
局部设置
默认的绘图背景是黑色的,若实际应用中不想使用黑色作为背景,可以自定义背景颜色,上文提到 pyqtgraph.PlotWidget 在初始化时,可以通过传入background参数,该参数即绘图的背景颜色,其合法值为pyqtgraph.mkColor函数的合法输入,包括以下形式:
- 以下字符中的一个: r, g, b, c, m, y, k, w
- R, G, B, [A] integers 0-255
- (R, G, B, [A]) tuple of integers 0-255
- float greyscale, 0.0-1.0
- int see :func:
intColor() - (int, hues) see :func:
intColor() - “RGB” hexadecimal strings; may begin with ‘#’
- “RGBA”
- “RRGGBB”
- “RRGGBBAA”
- QColor QColor instance; makes a copy.
笔者测试时使用白色背景,将
self.plt = pg.PlotWidget()
改为
self.plt = pg.PlotWidget(background="w")
效果变为
改变坐标刻度样式,添加坐标轴标题
默认的坐标轴刻度颜色是灰色,在白色背景下,不太好看清,并且没有添加坐标轴,这就需要注意到 pyqtgraph.PlotItem类了。
涉及到的几个封装类有:
pyqtgraph.PlotWidgetpyqtgraph.PlotItempyqtgraph.AxisItem
在初始化控件的时候,实例后的self.plt对象就是pyqtgraph.PlotWidget,通过以下方式可以获得其中的另外两个对象
pltItem = self.plt.getPlotItem()
left_axis = pltItem.getAxis("left")
其中 left_axis的轴是左边的坐标轴,传入 ‘bottom’, ‘top’, 或者 ‘right’参数可以获得其他的坐标轴
坐标轴标签很好更改,
labelStyle = {'color': '#000', 'font-size': '22pt'} # 字体颜色和大小
left_axis.setLabel('y轴', units='y轴单位', **labelStyle)
但在更改坐标刻度的字体大小时遇到了困难,官方文档给出的接口是AxisItem.setStyle(tickFont=QFont),但经过测试,该接口存在BUG,并不起作用,通过stack上搜索,以下方法可以有效更改
font = QFont()
font.setPixelSize(14)
left_axis.tickFont = font
但当刻度的字体过大时,容易造成刻度和坐标轴标题重合(如下图所示),需要注意

设置合适的字体大小后(颜色通过前文全局设置修改),效果如下图所示
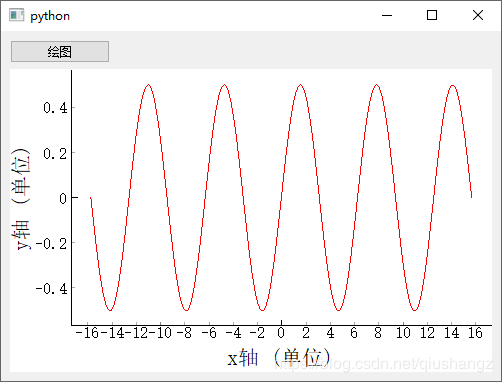
至此,基本绘图所需功能实现完毕
整体代码如下:
from PyQt5.QtWidgets import QApplication, QPushButton, QVBoxLayout, QMainWindow, QWidget, QFontDialog
from PyQt5.QtGui import QFont
import pyqtgraph as pg
import numpy as np
import sys

pg.setConfigOption('background', 'w')
pg.setConfigOption('foreground', 'k')


class TestWindow(QMainWindow):
    def __init__(self, parent=None):
        QMainWindow.__init__(self)
        # 设置窗体尺寸
        self.setGeometry(300, 300, 500, 350)
        # 添加一个按钮和一个PlotWidget
        self.draw_fig_btn = QPushButton("绘图")
        self.draw_fig_btn.setFixedWidth(100)
        self.plt = pg.PlotWidget(background="w")
        # 将两个Widget垂直排列布局
        # MainWindow的主体内容要通过一个widget包裹在一起,通过self.setCentralWidget设置
        centralWidget = QWidget()
        main_layout = QVBoxLayout()
        main_layout.addWidget(self.draw_fig_btn)
        main_layout.addWidget(self.plt)
        centralWidget.setLayout(main_layout)
        # 应用上述布局
        self.setCentralWidget(centralWidget)
        # 为[绘图]按钮注册一个回调函数
        self.draw_fig_btn.clicked.connect(self.draw_fig_btn_cb)

    def draw_fig_btn_cb(self):
        # [绘图]按钮回调函数
        x = np.linspace(-5 * np.pi, 5 * np.pi, 500)
        y = 0.5 * np.sin(x)
        self.plt.plot(x, y, pen="r")
        pltItem = self.plt.getPlotItem()
        left_axis = pltItem.getAxis("left")
        left_axis.enableAutoSIPrefix(False)
        font = QFont()
        font.setPixelSize(16)
        left_axis.tickFont = font
        bottom_axis = pltItem.getAxis("bottom")
        bottom_axis.tickFont = font
        labelStyle = {'color': '#000', 'font-size': '16pt'}
        left_axis.setLabel('y轴', units='单位', **labelStyle)
        bottom_axis.setLabel('x轴', units='单位', **labelStyle)


if __name__ == "__main__":
    app = QApplication(sys.argv)
    qb = TestWindow()
    qb.show()
    sys.exit(app.exec_())