Matplotlib ☞ Pyplot
matplotlib.pyplot 是一个命令风格函数的集合,使 matplotlib 的机制更像MATLAB。
下面是一个例子
import matplotlib.pyplot as plt
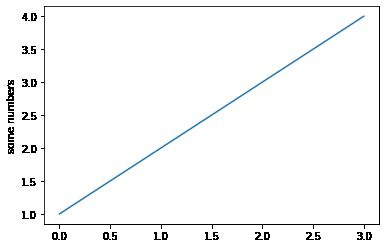
plt.plot([1,2,3,4])
plt.ylabel('some numbers')
plt.show()
为什么我之传入一个列表[1,2,3,4]一个参数就能够画出上面的值域为[1,4],定义域为[0,3]的图像呢?
这是因为如果你向plot()提供单个列表或者数组,matplotlib会默认将它认为是Y轴的序列,而自动为你生成从0开始的X值序列,且为整数,长度为Y轴传入列表或者数组的长度。
上面X序列会自动生成为[0,1,2,3]
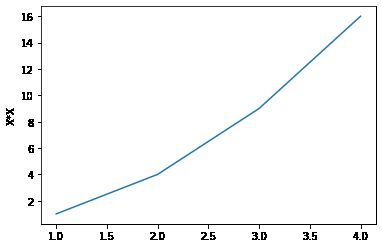
假如要绘制既有X又有Y序列的点集的图,我们可以使用下面的语句,第一个参数是X轴序列,第二个参数是Y轴序列
plt.plot([1,2,3,4],[1,4,9,16])
plt.ylabel('X*X')
plt.show()
plot()的第三个参数可以设置线条的格式fmt.
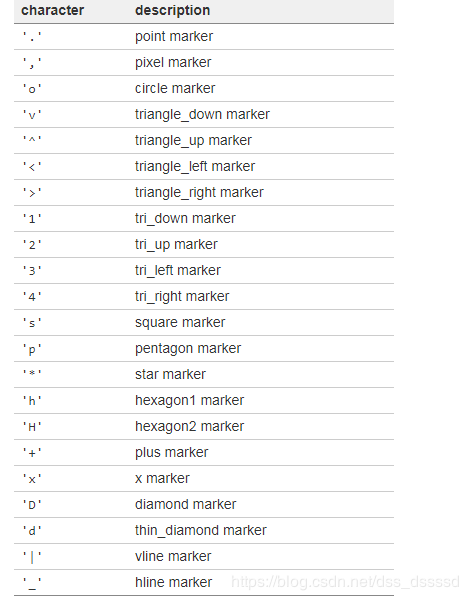
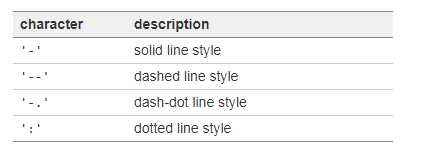
fmt='[color][marker][line]'(里面三者顺序随便)
color
maker
linestyle
而axis可以设置X轴与Y轴的范围,格式为:[X_min,X_max,Y_min,Y_max]
Pyplot配合numpy
import numpy as np
生成从0到5的多个浮点数,步长为0.2
X = np.arange(0.0,5,0.2)
X
array([0. , 0.2, 0.4, 0.6, 0.8, 1. , 1.2, 1.4, 1.6, 1.8, 2. , 2.2, 2.4,
       2.6, 2.8, 3. , 3.2, 3.4, 3.6, 3.8, 4. , 4.2, 4.4, 4.6, 4.8])
绘制多个函数线条
plt.plot(X,X,'r--',X,X**2,'bs',X,X**3,'g^')
plt.show()
控制线条的属性
线条的属性有如下:
- linewidth 线宽
- dash style 破折号样式
- antialiased 反锯齿
下面是一个超粗线宽的图像
plt.plot(X,X**2,linewidth = 10.0)
plt.show()
去除反锯齿
line,= plt.plot(X,X,'-')
line.set_antialiased(False)
使用setp()
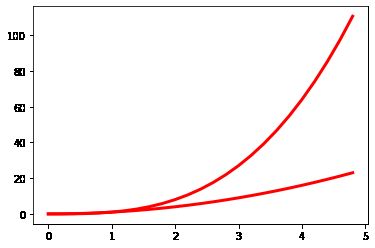
lines = plt.plot(X,X**2,X,X**3)
plt.setp(lines,color='r',linewidth=3.0)
#plt.setp(lines,'color','r','linewidth',3.0)
[None, None, None, None]
a = np.arange(1,4)
l = plt.plot(a)
#调用下面的语句会返回可设置线条属性的列表
plt.setp(l)
  agg_filter: a filter function, which takes a (m, n, 3) float array and a dpi value, and returns a (m, n, 3) array
  alpha: float
  animated: bool
  antialiased or aa: bool
  clip_box: `.Bbox`
  clip_on: bool
  clip_path: [(`~matplotlib.path.Path`, `.Transform`) | `.Patch` | None]
  color or c: color
  contains: callable
  dash_capstyle: {'butt', 'round', 'projecting'}
  dash_joinstyle: {'miter', 'round', 'bevel'}
  dashes: sequence of floats (on/off ink in points) or (None, None)
  drawstyle or ds: {'default', 'steps', 'steps-pre', 'steps-mid', 'steps-post'}, default: 'default'
  figure: `.Figure`
  fillstyle: {'full', 'left', 'right', 'bottom', 'top', 'none'}
  gid: str
  in_layout: bool
  label: object
  linestyle or ls: {'-', '--', '-.', ':', '', (offset, on-off-seq), ...}
  linewidth or lw: float
  marker: marker style
  markeredgecolor or mec: color
  markeredgewidth or mew: float
  markerfacecolor or mfc: color
  markerfacecoloralt or mfcalt: color
  markersize or ms: float
  markevery: None or int or (int, int) or slice or List[int] or float or (float, float)
  path_effects: `.AbstractPathEffect`
  picker: float or callable[[Artist, Event], Tuple[bool, dict]]
  pickradius: float
  rasterized: bool or None
  sketch_params: (scale: float, length: float, randomness: float)
  snap: bool or None
  solid_capstyle: {'butt', 'round', 'projecting'}
  solid_joinstyle: {'miter', 'round', 'bevel'}
  transform: `matplotlib.transforms.Transform`
  url: str
  visible: bool
  xdata: 1D array
  ydata: 1D array
  zorder: float
处理多个图形和轴域
MATLAB 和 pyplot 具有当前图形和当前轴域的概念。 所有绘图命令适用于当前轴域。
创建两个子图的方法
def f(x):
    return np.exp(-x) * np.cos(2*np.pi*x)

x1 = np.arange(0.0,5,0.1)
x2 = np.arange(0.0,5,0.02)

# figure命令可选,默认会自动创建figure(1)
plt.figure(1)
#subplot() 命令指定 numrows , numcols , fignum ,其中 fignum 的范围是:从 1 到 numrows * numcols 。
#下面 numrows = 2,numcols = 1,fignum = 1,也就是说,创建2行一列的图片摆放
plt.subplot(211)
plt.plot(x1,f(x1),'bo',x2,f(x2),'k')

plt.subplot(212)
plt.plot(x2,np.cos(2*np.pi*x2),'r--')

plt.show()
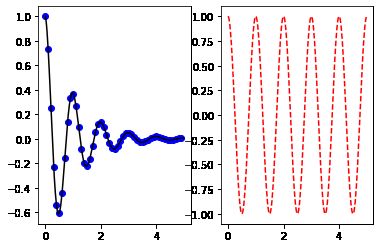
下面变成1行2列的图片摆放
plt.subplot(121)
plt.plot(x1,f(x1),'bo',x2,f(x2),'k')

plt.subplot(122)
plt.plot(x2,np.cos(2*np.pi*x2),'r--')

plt.show()
plt.figure(1) # 第一个图形
plt.subplot(211) # 第一个图形的第一个子图
plt.plot([1, 2, 3])
plt.subplot(212) # 第一个图形的第二个子图
plt.plot([4, 5, 6])

plt.figure(2) # 第二个图形
plt.plot([4, 5, 6]) # 默认创建 subplot(111)
plt.figure(1) # 当前是图形 1,subplot(212)
plt.subplot(211) # 将第一个图形的 subplot(211) 设为当前子图
plt.title('Easy as 1, 2, 3') # 子图 211 的标题
plt.show()
处理文本
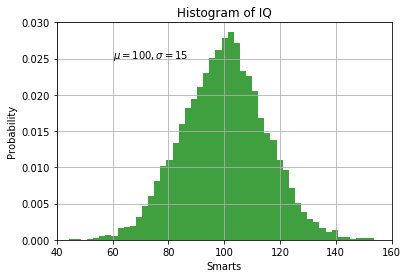
text() 命令可用于在任意位置添加文本, xlabel() , ylabel() 和 title() 用于在指定的位置添加文本
# 均值与方差
mean,sigma = 100,15
x = mean + sigma * np.random.randn(10000)

#数据直方图
n,bins,patchs = plt.hist(x,50,density = 1,facecolor = 'g',alpha=0.75)

plt.xlabel('Smarts')  #设置X轴标签
plt.ylabel('Probability') #设置Y轴标签
plt.title('Histogram of IQ') #设置图片的标题
plt.text(60,.025,r'$\mu=100,\sigma=15$') # 在指定坐标(60,0.025)添加文本,这里是一个公式
plt.axis([40,160,0,0.03]) #设置横纵坐标的范围
plt.grid(True) #设置网格
plt.show()
