python 绘制降水量色斑图
# 引用部分
import numpy as np
import pandas as pd
from scipy.interpolate import Rbf  # 径向基函数 : 将站点信息插到格点上 用于绘制等值线

import matplotlib.pyplot as plt
import matplotlib.colors as colors
import matplotlib as mpl

import cartopy.crs as ccrs
import cartopy.io.shapereader as shpreader
from cartopy.mpl.ticker import LongitudeFormatter,LatitudeFormatter

import maskout  #只显示某个地区

plt.rcParams['font.sans-serif']=['SimHei'] #用来正常显示中文
plt.rcParams['axes.unicode_minus']=False #用来正常显示负号
# 数据准备
df = pd.read_excel('工作簿1.xlsx') #读取Excel
df.columns = ['stid','lon','lat','height','rain']
# df = df[(df['rain']>0)&(df['lat']>35)&(df['lon']>115)&(df['lat']<50)&(df['lon']<130)]  #筛选坐标在某个范围内,由于数据量少,直接在EXCEL中做处理
lon = df['lon']
lat = df['lat']
rain = df['rain']
# 绘图准备
olon = np.linspace (125,131,120) #经纬坐标,0.05°分辨率 118°到126°0.05分辨率是有160个格点
olat = np.linspace (44,47,60) #纬度坐标,0.05°分辨率
olon,olat = np.meshgrid(olon,olat) #生成坐标网格 meshgrid网格化
func = Rbf(lon,lat,rain,function='linear') #插值函数 调用Rbf插值函数中的 cubic 插值法linear
rain_data_new = func(olon,olat) #插值
rain_data_new[rain_data_new <0 ] = 0
#画布及绘图声明
fig = plt.figure(figsize = (16,9.6),facecolor = '#666666',edgecolor = 'Blue',frameon = False)  # 画布
ax = fig.add_subplot(111,projection=ccrs.PlateCarree()) #绘图区

#色彩定制:24小时降水量级色标
clevs = [0.1,10.,25.,50.,100.,250.,500] #自定义颜色列表
cdict = ['#A9F090','#40B73F','#63B7FF','#0000FE','#FF00FC','#850042'] #自定义颜色列表 '#A9F090','#40B73F','#63B7FF','#0000FE','#FF00FC','#850042'
my_cmap = colors.ListedColormap(cdict) # 自定义颜色映射 color-map
norm = mpl.colors.BoundaryNorm(clevs,my_cmap.N) # 基于离散区间生成颜色映射索引
#  绘制等值线、等值线填色
cf = ax.contourf(olon,olat,rain_data_new,clevs,transform = ccrs.PlateCarree(),cmap=my_cmap,norm = norm)
# ct = ax.contour(olon,olat,rain_data_new,clevs)   # 绘制等值线
# clabel = ax.clabel(ct,fmt = '%i')
position = fig.add_axes([0.82,0.2,0.05,0.2]) #位置【左,下,宽。高】
plt.colorbar(cf,cax=position)     # 颜色参照表
position.set_yticklabels((0,10,25,50,100,250,500))
ax.xaxis.set_major_formatter(LongitudeFormatter(zero_direction_label=True))
ax.yaxis.set_major_formatter(LatitudeFormatter())
ax.set_xticks(np.arange(125,131,2),crs = ccrs.PlateCarree())    # x轴
ax.set_yticks(np.arange(44,47,2),crs = ccrs.PlateCarree())      # y轴
# ax.gridlines()  #显示背景线

# # # #裁切
# clip = maskout.shp2clip(cf,ax,'haerbin/hrb.shp')
clip = maskout.shp2clip(cf,ax,'haerbin/hrb.shp','hrb') #haerbin/shijie.shp  shp/黑龙江省/市界.shp

#从全国实际地图中获取辽宁省的市级边界并加载
# shpname = r'haerbin/hrb.shp'  # shp/country1.shp
# adm1_shapes=list(shpreader.Reader(shpname).geometries())
# ax.add_geometries(adm1_shapes[:],ccrs.PlateCarree(),edgecolor='k',facecolor='') #36:72东三省
plt.savefig('111.png')
**
maskout.py
**
#coding=utf-8
###################################################################################################################################
#####This module enables you to maskout the unneccessary data outside the interest region on a matplotlib-plotted output instance
####################in an effecient way,You can use this script for free     ########################################################
#####################################################################################################################################
#####USAGE: INPUT  include           'originfig':the matplotlib instance##
#                                    'ax': the Axes instance
#                                    'shapefile': the shape file used for generating a basemap A
#                                    'region':the name of a region of on the basemap A,outside the region the data is to be maskout
#           OUTPUT    is             'clip' :the the masked-out or clipped matplotlib instance.
import shapefile
from matplotlib.path import Path
from matplotlib.patches import PathPatch
def shp2clip(originfig,ax,shpfile,region):

    sf = shapefile.Reader(shpfile,encoding='utf-8')
    for shape_rec in sf.shapeRecords():
        if shape_rec.record[2] == region:  ####这里需要找到和region匹配的唯一标识符,record[]中必有一项是对应的。
            vertices = []
            codes = []
            pts = shape_rec.shape.points
            prt = list(shape_rec.shape.parts) + [len(pts)]
            for i in range(len(prt) - 1):
                for j in range(prt[i], prt[i+1]):
                    vertices.append((pts[j][0], pts[j][1]))
                codes += [Path.MOVETO]
                codes += [Path.LINETO] * (prt[i+1] - prt[i] -2)
                codes += [Path.CLOSEPOLY]
            clip = Path(vertices, codes)
            clip = PathPatch(clip, transform=ax.transData)
    for contour in originfig.collections:
        contour.set_clip_path(clip)
    return clip
数据(自己造的) 列分别为 ID 、经度 、纬度 、高度(用不到) 、 降水量

还需要一个shp文件,自己百度下载吧。
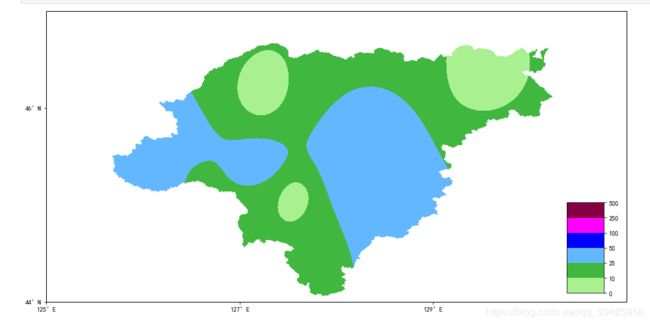
最终结果如下:哈尔滨地区降水量色斑图