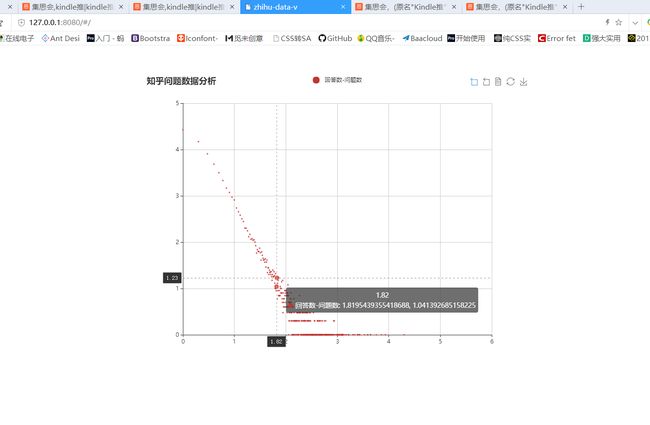
前段时间看了一节公开课,教的是用node.js来爬知乎的数据。
下面会给出github地址,也会附上代码,简单记录一下自己踩过的坑。
https://github.com/zhangjing9898/crawler
这是爬问题的函数
async function getQuestion(db, id) {
    let res = await rp({url: `https://www.zhihu.com/question/${id}`});
    let $ = cheerio.load(res);

    let data = $('#data').attr('data-state');

    let state = JSON.parse(htmlDecode(data));
    let question = state.entities.questions[id];

    db.collection("questions")
        .insert(question)
    console.log(`question id : ${id} insert into db`)
    await getAnswers(db, id, question.answerCount)

}
这是爬该问题的评论数
async function getAnswers(db, id, answerCount) {
    for (let offset = 0; offset < answerCount; offset += 20) {
        let res = await rp({
            url: `https://www.zhihu.com/api/v4/questions/${id}/answers?sort_by=default&include=data%5B%2A%5D.is_normal%2Cadmin_closed_comment%2Creward_info%2Cis_collapsed%2Cannotation_action%2Cannotation_detail%2Ccollapse_reason%2Cis_sticky%2Ccollapsed_by%2Csuggest_edit%2Ccomment_count%2Ccan_comment%2Ccontent%2Ceditable_content%2Cvoteup_count%2Creshipment_settings%2Ccomment_permission%2Ccreated_time%2Cupdated_time%2Creview_info%2Crelevant_info%2Cquestion%2Cexcerpt%2Crelationship.is_authorized%2Cis_author%2Cvoting%2Cis_thanked%2Cis_nothelp%2Cupvoted_followees%3Bdata%5B%2A%5D.mark_infos%5B%2A%5D.url%3Bdata%5B%2A%5D.author.follower_count%2Cbadge%5B%3F%28type%3Dbest_answerer%29%5D.topics&limit=20&offset=${offset}`,
            headers: {
                authorization: "oauth c3cef7c66a1843f8b3a9e6a1e3160e20"
            }
        })
        let data = JSON.parse(res);
        let answers = data.data;
        db.collection("answers").insertMany(answers);
    }
}
这是main·函数:
async function main() {
    let url = 'mongodb://localhost:27017/crawler';
    let db = await MongoClient.connect(url);

    for(let id=30000000;id<40000000;id++){
        try {
            await getQuestion(db,id);
        }catch (err){
            console.log(`question id : ${id}`);
        }
    }
    //爬知乎数据,详细版:
    // let url="mongodb://localhost:27017/crawler";
    // let db=await MongoClient.connect(url);
    //
    // await Promise.map(
    //     [...range(start,end)],
    //     async i=>{
    //         try{
    //             await retry(async()=>{
    //                 let question=await db.collection('questions').findOne({id:i});
    //                 if(question){
    //                     console.log(`question id:${i} already exists,skip`)
    //                 }else{
    //                     try {
    //                         await Promise.resolve(getQuestion(db,i)).timeout(20000);
    //                     }catch(err){
    //                         if(err.name=='StatusCodeError'){
    //                             return console.log(`question id:${i} StatusCodeError is ${err.statusCode}`)
    //                         }
    //                         console.log(`question id:${i} error occur,${err.name},retry......`);
    //                         throw err;
    //                     }
    //                 }
    //             },{max_tries:10,interval:2000})
    //         }catch (err){
    //             console.log(`question id: ${i} retry fail,drop`)
    //         }
    //     },
    //     {concurrency:50}  /*控制并发数*/
    // )
}
main().catch(err => console.log(err))
数据爬出来了,下一步就是将它可视化展示,这里用到了echarts,其实用图表展示可以使用echarts或者d3,d3展示的图类更加丰富,同时难度大于echarts,所以这里用的vue-echarts,用了vue的脚手架来构建,下面会给出github地址。
坑:
1.vue的脚手架下 使用eslintrc规范,如果不想使用这种规范,可以在config目录下的index.js的useEslint: 设置为false。
2.在对数据库中的数据进行聚合已经分类等的时候,我用了mongovue中的aggravate。
下面来记录一哈步骤:
 //stage 1
            {
                $group: {
                    _id: '$id',
                    visitCount: {$last: '$visitCount'},
                    topics: {$last: '$topics'},
                    answerCount: {$last: '$answerCount'},
                    created: {$last: '$created'},
                    updateTime: {$last: '$updateTime'},
                    commentCount: {$last: 'commentCount'},
                    followerCount: {$last: 'followerCount'}
                }
            },
//stage 2
            {
                $out: "d_questions"
            },
选中collections 然后找到aggressive选项 然后把上面这一块paste上去 。它的意思就相当于mysql中的distinct+group by ,再把结果输出在d_questions这个collections里面。
{
                $group: {
                    _id: '$answerCount',
                    count:{"$sum":1}
                }
            },
            {
                $out: "t"
            },
同理 这一块的意思是 聚合分类 比如评论数为1的个数是5000条 评论数为60 的个数只有1 ,用于后面做词云图等等。
这是爬知乎数据做可视化分析的 github地址:https://github.com/zhangjing9898/zhihu-data-view
这是将数据可视化。
这里的chart都是echarts里面的
在后台如何分析数据,可以用到nodejieba这个库 可以将长句子或者文章进行分词操作 然后计算分析

