import numpy as np
from sklearn.tree import DecisionTreeRegressor
import matplotlib.pyplot as plt
%matplotlib inline
n = 100
x = np.random.rand(n)*6 - 3
x.sort()
y = np.sin(x) + np.random.rand(n) + 0.06
x = x.reshape(-1,1)
y = y.reshape(-1,1)
dtr = DecisionTreeRegressor(criterion='mse', max_depth=3)
dtr.fit(x,y)
x_test = np.linspace(-3,3,50).reshape(-1,1)
y_pre = dtr.predict(x_test)
plt.figure(figsize=(8,6)
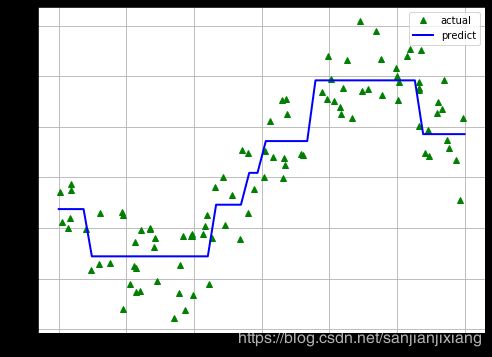
plt.plot(x,y,'g^',label='actual')
plt.plot(x_test,y_pre,'b-',linewidth=2,label='predict')
plt.grid()
plt.legend(loc='best')
plt.show()
depth = [2,4,6,8,10]
colors = 'rgbmy'
linestyles = ['--','-','-.',':','--']
dtr = DecisionTreeRegressor()
plt.subplots(figsize=(12,10))
plt.plot(x,y,'ko',label='actual')
for d,c,l in zip(depth, colors, linestyles):
	dtr.set_params(max_depth = d)
	dtr.fit(x, y)
	y_pre = dtr.predict(x_test)
	plt.plot(x_test,y_pre,linestyle=l,color=c,linewidth=2.5,label='depth=%d' % d)
plt.legend(loc='best')
plt.grid()
plt.show()
