DecisionTreeClassifier实例:Iris莺尾花分类
文章目录
- Decision Trees决策树
- DecisionTreeClassifier 参数
- 实例:Iris鸢尾花数据集的决策树分类
- 基础版本
- 进阶版本
- 代码细节
- python.enumerate()
- numpy.meshgrid()
- pyplot.tight_layout()
- numpy.ravel()
- numpy.c_
- Z = clf.predict(np.c_[xx.ravel(), yy.ravel()])
- cs = plt.contourf(xx, yy, Z, cmap=plt.cm.RdYlBu)
- 参考链接
Decision Trees决策树
决策树是一种监督学习算法(具有预定义的目标变量),主要用于分类,也可用于回归。sklearn.tree.DecisionTreeClassifier 可用于决策树分类问题:sci-kit learn Documentation Examples 1.10. Decision Trees
后面会专门补一篇决策树的原理等基础内容,这里主要介绍sklearn库中DecisionTreeClassifier类的使用。
DecisionTreeClassifier 参数
class sklearn.tree.DecisionTreeClassifier(criterion='gini', splitter='best',max_depth=None,min_samples_split=2,
min_samples_leaf=1, min_weight_fraction_leaf=0.0, max_features=None,random_state=None, max_leaf_nodes=None,
class_weight=None,presort=False)
参数表
| 名称 | 功能 | 描述 |
|---|---|---|
| criterion | 特征选择标准 | ‘gini’ or ‘entropy’ (default=”gini”),即基尼系数或信息熵,两种算法的准确率差异不大,信息熵的效率更低一些(因为它有对数运算);一般使用默认的基尼系数”gini”即CART算法,除非你更喜欢类似ID3, C4.5的最优特征选择方法。 |
| splitter | 特征划分标准 | ‘best’ or ‘random’ (default=”best”) 前者是在特征的所有划分点中找出最优的划分点,后者是随机的在部分划分点中找局部最优的划分点。 默认的”best”适合样本量不大的情况,而如果样本数据量非常大,此时决策树构建推荐”random” |
| max_depth | 决策树最大深度 | int or None, optional (default=None) 一般来说,数据少或者特征少的时候采用默认值None,那么决策树将扩展节点直到所有叶子都是纯的或直到所有叶子包含少于min_samples_split样本;如果模型样本量多,特征也多的情况下,推荐限制这个最大深度;深度越大,越容易过拟合,推荐树的深度为:5-20之间 |
| min_samples_split | 内部节点再划分所需最小样本数 | int, float, optional (default=2) 如果是 int,则取传入值本身作为最小样本数; 如果是 float,则取ceil(min_samples_split * 样本数量) 的值作为最小样本数,即向上取整。 |
| min_samples_leaf | 叶子节点最少样本数 | int,float,optional(default = 1)这个值限制了叶子节点所需的最少样本数,如果某叶子节点数目小于样本数,则会和兄弟节点一起被剪枝。 |
| max_leaf_nodes | 最大叶子节点数 | int or None, optional (default=None) 通过限制最大叶子节点数,可以防止过拟合,默认是”None”,即不限制最大的叶子节点数。如果加了限制,算法会在最大叶子节点数内建立最优的决策树,具体的值可以通过交叉验证得到。 |
| min_impurity_decrease | 节点划分最小不纯度 | float, optional (default=0.)这个值限制了决策树的增长,如果某节点的不纯度(基尼系数,信息增益,均方差,绝对差)小于这个阈值则该节点不再生成子节点,即为叶子节点 |
| min_impurity_split | 信息增益的阀值 | float, (default=1e-7)决策树在创建分支时,信息增益必须大于这个阀值,否则不分裂,成为叶子节点。从版本0.19开始改用min_impurity_decrease |
| class_weight | 类别权重 | dict, list of dicts, “balanced” or None,(default=None),指定样本各类别的的权重,主要是为了防止训练集某些类别的样本过多导致训练的决策树过于偏向这些类别。这里可以自己指定各个样本的权重,如果使用“balanced”,则算法会自己计算权重,与各个类别的样本量成反比。如果你的样本类别分布没有明显的偏倚,则可以不管这个参数,选择默认的”None” |
模型调参注意事项
1.当样本数量少但样本特征非常多的时候,决策树很容易过拟合,一般来说,样本数比特征数多一些更容易建立健壮的模型;
2.如果样本数量少但是样本特征非常多,在拟合决策树模型前,推荐先做维度规约,比如主成分分析(PCA),特征选择(Losso)或者独立成分分析(ICA),这样特征的维度会大大减小,再来拟合决策树模型效果会好;
3.推荐使用决策树的可视化,同时先限制决策树的深度(比如最多3层),这样可以先观察生成的决策树里数据的初步拟合情况,然后再决定是否要增加深度;
4.在训练模型之前,注意观察样本的类别情况(主要指分类树),如果类别分布非常不均匀,就要考虑用class_weight来限制模型过于偏向样本多的类别;
5.决策树的数组使用的是numpy的float32类型,如果训练数据不是这样的格式,算法会先做copy再运行;
6.如果输入的样本矩阵是稀疏的,推荐在拟合前调用csc_matrix稀疏化,在预测前调用csr_matrix稀疏化。
属性表
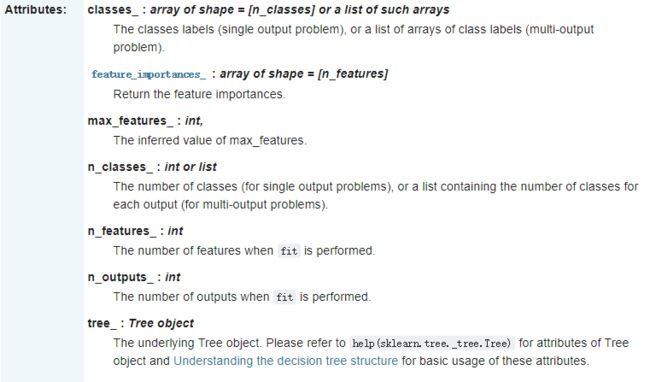
常用属性:
classes_:分类的标签值
n_classes_:给出了分类的数量
方法表

常用方法:
fit(X, y[, sample_weight, check_input, …]):训练模型
predict(X[, check_input]):用模型进行预测,返回预测值
predict_log_proba(X):返回一个数组,数组的元素依次是X预测为各个类别的概率的对数值
predict_proba(X):返回一个数组,数组的元素依次是X预测为各个类别的概率值
score(X,y[,sample_weight]):返回模型的预测性能得分
实例:Iris鸢尾花数据集的决策树分类
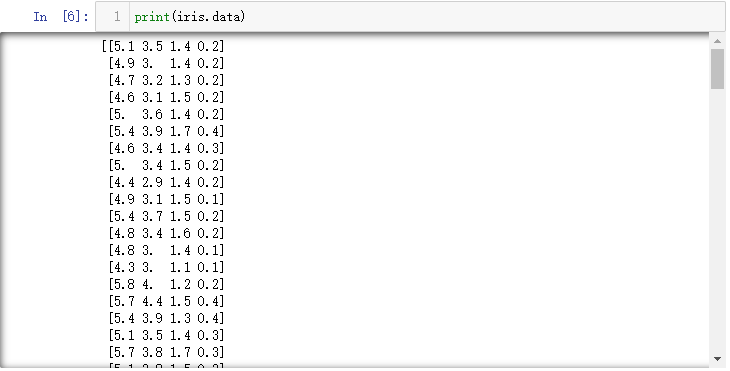
Iris 鸢尾花数据集包含 3 类共 150 条记录(每类各 50 条),每条记录都有 4 项特征:花萼长度、花萼宽度、花瓣长度、花瓣宽度,可以通过这4个特征预测鸢尾花卉属于3类(iris-setosa, iris-versicolour, iris-virginica)中的哪一类品种。
先来看一看数据集长什么样子,更多可视化参考链接【3】Iris数据集可视化
import numpy as np
import pandas as pd
import matplotlib.pyplot as plt

from sklearn.datasets import load_iris

# Load data
iris = load_iris()
url = "https://archive.ics.uci.edu/ml/machine-learning-databases/iris/iris.data"
names = ['sepal-length', 'sepal-width', 'petal-length', 'petal-width', 'class']
dataset = pd.read_csv(url, names=names)
print(dataset.describe())
接下来使用Sklearn中的DecisionTreeClassifier类进行分类
基础版本
print(__doc__)

import numpy as np
import matplotlib.pyplot as plt
from sklearn.model_selection import train_test_split
from sklearn import metrics

from sklearn.datasets import load_iris
from sklearn.tree import DecisionTreeClassifier, plot_tree

# Load data
iris = load_iris()

#划分训练集和测试集
x_train,x_test,y_train,y_test=train_test_split(iris.data,iris.target,test_size=0.3)

#训练,预测
clf=DecisionTreeClassifier()
clf.fit(x_train,y_train)
predict_target=clf.predict(x_test)

#预测结果与真实结果的对比
print(sum(predict_target==y_test))

#输出准确率,召回率,F值
print(metrics.classification_report(y_test,predict_target))
#print(metrics.confusion_matrix(y_test, predict_target))

#获取花卉测试数据集两列数据集
X = x_test
L1 = [n[0] for n in X]
print(L1)
L2 = [n[1] for n in X]
print(L2)

#绘图
plt.scatter(L1, L2, c=predict_target, marker='x')  #cmap=plt.cm.Paired
plt.title("DecisionTreeClassifier")
plt.show()
进阶版本
From scikit-learn Documentation Examples: Plot the decision surface of a decision tree on the iris dataset
作为小白,代码基础欠缺太严重,索性一个一个细节去查,全部放在后面了
print(__doc__)

import numpy as np
import matplotlib.pyplot as plt

from sklearn.datasets import load_iris
from sklearn.tree import DecisionTreeClassifier, plot_tree

# Parameters
n_classes = 3
plot_colors = "ryb"
plot_step = 0.02

# Load data
iris = load_iris()

#列表的元素类型可以是数字,字符串,列表
#enumerate()函数,组成索引序列,且不需初始化索引,常用于for循环里
for pairidx, pair in enumerate([[0, 1], [0, 2], [0, 3],
                                [1, 2], [1, 3], [2, 3]]):
    # We only take the two corresponding features
    X = iris.data[:, pair]
    y = iris.target

    # Train
    clf = DecisionTreeClassifier().fit(X, y)

   # Plot the decision boundary. For that, we will assign a color to each
   # point in the mesh [x_min, x_max]x[y_min, y_max].

    #设置子图,pairidx+1 因为pairidx索引是从0开始的
    plt.subplot(2, 3, pairidx + 1)
    #设置坐标轴显示的起点和终点
    x_min, x_max = X[:, 0].min() - 1, X[:, 0].max() + 1
    y_min, y_max = X[:, 1].min() - 1, X[:, 1].max() + 1
    #meshgrid()函数,生成坐标点网格矩阵
    xx, yy = np.meshgrid(np.arange(x_min, x_max, plot_step),
                         np.arange(y_min, y_max, plot_step))
    #tight_layout()紧密布局函数可以避免子图堆叠
    plt.tight_layout(h_pad=0.5, w_pad=0.5, pad=2.5)

    #ravel()降维,np.c_()按列堆叠即按行拼接,这里把两个坐标轴数组变成了一个网格点矩阵
    Z = clf.predict(np.c_[xx.ravel(), yy.ravel()])#np.c_之后的维度是网格点数*2(1列横坐标,1列纵坐标)
    #Put the result into a color plot
    Z = Z.reshape(xx.shape) #这里xx.shape和yy.shape一致,均为网格矩阵的排布
    #contourf()生成等高线图
    cs = plt.contourf(xx, yy, Z, cmap=plt.cm.RdYlBu)

    plt.xlabel(iris.feature_names[pair[0]])
    plt.ylabel(iris.feature_names[pair[1]])

    # Plot the training points

    #zip()合并后返回一个tuple列表
    for i, color in zip(range(n_classes), plot_colors):
        idx = np.where(y == i)
        plt.scatter(X[idx, 0], X[idx, 1], c=color, label=iris.target_names[i],
                    cmap=plt.cm.RdYlBu, edgecolor='black', s=15)

plt.suptitle("Decision surface of a decision tree using paired features")
plt.legend(loc='lower right', borderpad=0, handletextpad=0)
plt.axis("tight")

plt.figure()
clf = DecisionTreeClassifier().fit(iris.data, iris.target)
plot_tree(clf, filled=True)
plt.show()
代码细节
python.enumerate()
enumerate(sequence, [start=0]) 是Python的内置函数,用于将一个可遍历的数据对象(如列表、元组或字符串)组合为一个索引序列,同时列出索引和值,一般用在 for 循环当中。
- 返回 enumerate(枚举) 对象
seasons = ['Spring', 'Summer', 'Fall', 'Winter']
l1=list(enumerate(seasons))
l2=list(enumerate(seasons, start=1)) #下标从 1 开始
print(l1)
print(l2)
- for 循环使用 enumerate
seq = ['one', 'two', 'three']
for i, element in enumerate(seq):
    print (i,element)
numpy.meshgrid()
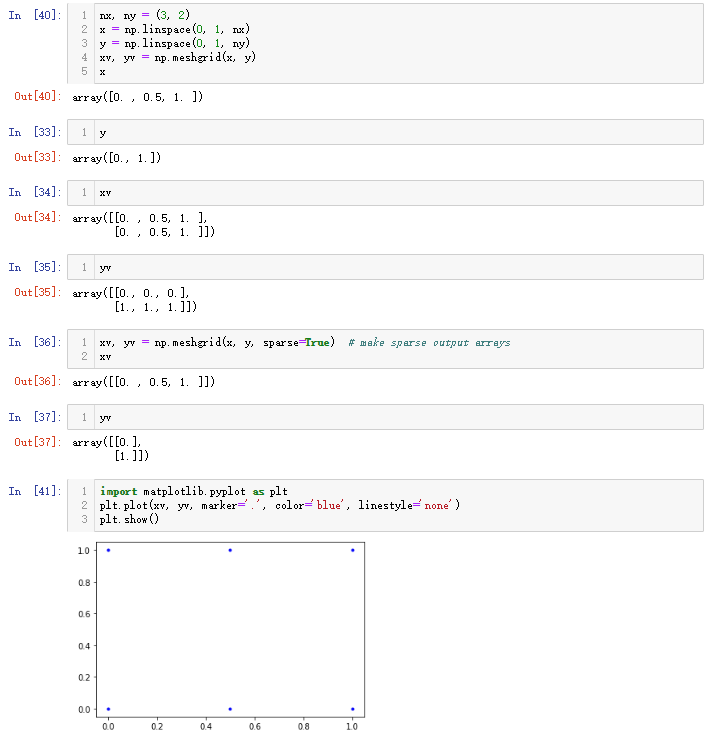
meshgrid函数的官方解释为Return coordinate matrices from coordinate vectors.
可以理解为,由一维坐标向量生成网格点坐标矩阵
示例1
nx, ny = (3, 2)
x = np.linspace(0, 1, nx)
y = np.linspace(0, 1, ny)
xv, yv = np.meshgrid(x, y)
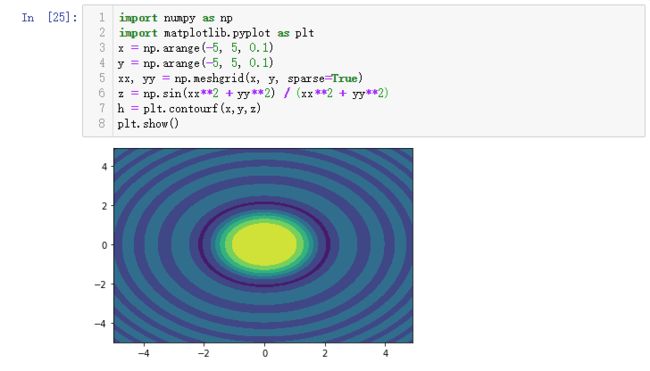
import numpy as np
import matplotlib.pyplot as plt
x = np.arange(-5, 5, 0.1)
y = np.arange(-5, 5, 0.1)
xx, yy = np.meshgrid(x, y, sparse=True)
z = np.sin(xx**2 + yy**2) / (xx**2 + yy**2)
h = plt.contourf(x,y,z)
plt.show()
pyplot.tight_layout()
matplotlib.pyplot.tight_layout(pad=1.08, h_pad=None, w_pad=None, rect=None)
“Automatically adjust subplot parameters to give specified padding.”
Parameters:
pad : float
padding between the figure edge and the edges of subplots, as a fraction of the font-size.
h_pad, w_pad : float
padding (height/width) between edges of adjacent subplots. Defaults to pad_inches.
rect : if rect is given, it is interpreted as a rectangle
(left, bottom, right, top) in the normalized figure coordinate that the whole subplots area (including labels) will fit into. Default is (0, 0, 1, 1).
- 它可以自动调整子图参数,使之填充整个图像区域;
- 这是个实验特性,可能在一些情况下不工作;
- 它仅仅检查坐标轴标签、刻度标签以及标题的部分。
在 matplotlib 中,轴域(包括子图)的位置以标准化图形坐标指定。有时轴标签或标题(有时甚至是刻度标签)会超出图形区域,而因此被截断。为了避免这种情况,轴域的位置需要调整,这可以通过调整子图参数来解决(移动轴域的一条边来给刻度标签腾地方),而Matplotlib的命令tight_layout()也可以自动解决这个问题;当你拥有多个子图时,会经常看到不同轴域的标签叠在一起,如下图所示,而tight_layout()也会调整子图之间的间隔来减少堆叠。
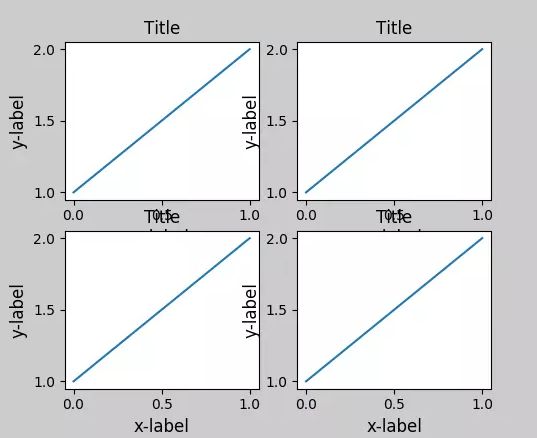
其他功能和示例详见 Tight Layout guide.
numpy.ravel()
numpy.ravel() vs numpy.flatten()两者所要实现的功能是一致的:将多维数组降为一维。两者区别在于返回拷贝(copy)还是返回视图(view):numpy.flatten()返回一份拷贝,对拷贝所做的修改不会影响(reflects)原始矩阵,而numpy.ravel()返回的是视图(view,也颇有几分C/C++引用reference的意味),会影响(reflects)原始矩阵。

numpy.c_
np.c_中的c是column(列)的缩写,是按列叠加两个矩阵的意思,也可以说是按行连接两个矩阵,就是把两矩阵左右相加,要求行数相等,类似于pandas中的merge()
np.r_中的r是row(行)的缩写,是按行叠加两个矩阵的意思,也可以说是按列连接两个矩阵,就是把两矩阵上下相加,要求列数相等,类似于pandas中的concat()
import numpy as np
a = np.array([[1,2,3],[7,8,9]])
b = np.array([[4,5,6],[1,2,3]])
c=np.c_[a,b]
d=np.r_[a,b]

下图是numpy.c_的官方examples
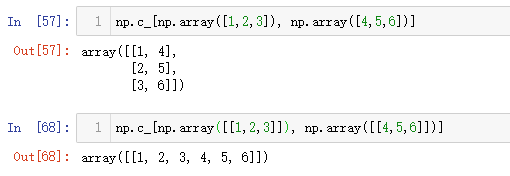
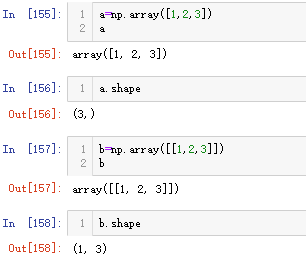
这里需要注意ndarray的数据格式,array()仅有一个方括号,则代表秩为1的数组(rank 1 array),既不是行向量,也不是列向量,这两篇博客讲的很清晰: 参考链接【10】Numpy的数组与向量辨析, 参考链接【11】Numpy-rank 1 array
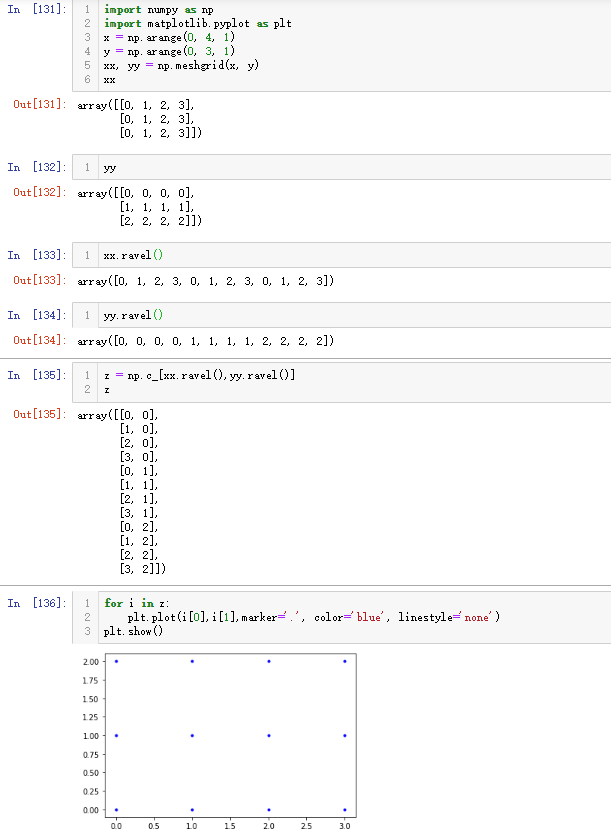
Z = clf.predict(np.c_[xx.ravel(), yy.ravel()])
这里实际是将meshgrid得到的坐标矩阵的横坐标和纵坐标进行配对(拼接)得到网格点的完整坐标,然后进行分类预测

cs = plt.contourf(xx, yy, Z, cmap=plt.cm.RdYlBu)
等高线是三维函数在二维平面的投影,生成等高线图需要三维点(xx,yy)和对应的高度值Z(由clf.predict()生成的预测值);这里的x,y是由meshgrid()在二维平面中将每一个x和每一个y分别对应起来编织成网格,cmap指定了等高线间的填充颜色。
主要参数

【注】 plt.contourf 与 plt.contour 区别:
f:filled,即对等高线间的填充区域进行填充(使用不同的颜色);
contourf:将不再绘制等高线(显然不同的颜色分界就表示等高线本身)。
更多内容:
参考链接【12】matplotlib.pyplot.contourf()
参考链接【13】莫烦的教程-Contours等高线图
参考链接
【1】Sklearn文档 https://scikit-learn.org/dev/modules/tree.html#classification
【2】DecisionTreeClassifier参数+实例:预测泰坦尼克号幸存者 http://ihoge.cn/2018/DecisionTree.html
【3】Iris数据集可视化 https://www.jianshu.com/p/eff2df3984e1
【4】python.enumerate() https://www.runoob.com/python/python-func-enumerate.html
【5】numpy.meshgrid() https://docs.scipy.org/doc/numpy/reference/generated/numpy.meshgrid.html?highlight=meshgrid
【6】meshgrid()通俗理解 https://blog.csdn.net/lllxxq141592654/article/details/81532855
【7】matplotlib.tight_layout() https://matplotlib.org/users/tight_layout_guide.html
【8】numpy.ravel() https://docs.scipy.org/doc/numpy/reference/generated/numpy.ravel.html
【9】numpy.c_() https://docs.scipy.org/doc/numpy/reference/generated/numpy.c_.html
【10】Numpy的数组与向量辨析 https://blog.csdn.net/qq_37070419/article/details/89066618
【11】Numpy-rank 1 array https://www.jianshu.com/p/9ff7a3c9a182
【12】matplotlib.pyplot.contourf() https://matplotlib.org/api/_as_gen/matplotlib.pyplot.contourf.html#matplotlib.pyplot.contourf
【13】莫烦的教程-Contours等高线图 https://morvanzhou.github.io/tutorials/data-manipulation/plt/3-3-contours/

