数据分析实战项目| 用户消费行为的分析报告
用户消费行为的分析报告
数据来源 CDNow 网站的用户购买明细,通过各个指标对用户行为进行分析,可以更清楚了解用户行为习惯,为进一步制定营销策略提供依据。
具体指标包括:
- 户消费趋势分析
- 用户个体消费分析
- 用户消费行为分析
- 复购率和回购率分析
- 留存率分析
一、理解数据
本数据集共有 6 万条左右数据,数据为 CDNow 网站 1997年1月至1998年6月的用户行为数据,共计 4 列字段,分别是:
- user_id: 用户ID
- order_dt: 购买日期
- order_products: 购买产品数
- order_amount: 购买金额
二、清洗数据
import pandas as pd
import numpy as np
import matplotlib.pyplot as plt
import seaborn as sns
%matplotlib inline
plt.rcParams['font.sans-serif']=['SimHei']
plt.rcParams['axes.unicode_minus']=False
plt.style.use('ggplot')
1. 数据加载
columns = ['user_id', 'order_dt', 'order_products', 'order_amount']
# 将 order_dt 转化为日期数据类型格式
dateparse = lambda dates: pd.datetime.strptime(dates,'%Y%m%d')
df = pd.read_table(r'C:\Users\86134\Desktop\CDNOW_master.txt',
                   names = columns,parse_dates=['order_dt'],
                   sep = '\s+',date_parser=dateparse
                    )
3.数据探索
print(df.info())
print('-'*30)
print(df.isnull().sum())
print('-'*30)
print(df.describe())
print('-'*30)
print(df.head())
print('-'*30)
print(df.tail())
print('-'*30)
输出
RangeIndex: 69659 entries, 0 to 69658
Data columns (total 4 columns):
user_id           69659 non-null int64
order_dt          69659 non-null datetime64[ns]
order_products    69659 non-null int64
order_amount      69659 non-null float64
dtypes: datetime64[ns](1), float64(1), int64(2)
memory usage: 2.1 MB
None
------------------------------
user_id           0
order_dt          0
order_products    0
order_amount      0
dtype: int64
------------------------------
            user_id  order_products  order_amount
count  69659.000000    69659.000000  69659.000000
mean   11470.854592        2.410040     35.893648
std     6819.904848        2.333924     36.281942
min        1.000000        1.000000      0.000000
25%     5506.000000        1.000000     14.490000
50%    11410.000000        2.000000     25.980000
75%    17273.000000        3.000000     43.700000
max    23570.000000       99.000000   1286.010000
------------------------------
   user_id   order_dt  order_products  order_amount
0        1 1997-01-01               1         11.77
1        2 1997-01-12               1         12.00
2        2 1997-01-12               5         77.00
3        3 1997-01-02               2         20.76
4        3 1997-03-30               2         20.76
------------------------------
       user_id   order_dt  order_products  order_amount
69654    23568 1997-04-05               4         83.74
69655    23568 1997-04-22               1         14.99
69656    23569 1997-03-25               2         25.74
69657    23570 1997-03-25               3         51.12
69658    23570 1997-03-26               2         42.96
------------------------------
通过数据探索我们发现
- 大部分订单只购买了少量商品 (平均 2.4), 有一定极值干扰;
- 用户消费的金额比较稳定, 平均消费 35 元, 中位数在 35 元, 有一定极值干扰;
- 数据呈右偏分布;
- 没有空缺数据,可以直接分析,但考虑到是按月分析,所以将日期进行解析(实际业务是否按月分析,取决于消费频率) 。
# 解析日期
df['oreder_dt'] = pd.to_datetime(df.order_dt, format='%Y%m%d')
df['month'] = df.order_dt.values.astype('datetime64[M]')
三、用户消费趋势分析(按月)
- 每月的产品购买数量
- 每月的消费总金额
- 每月的消费次数
- 每月的消费人数
1.每月的产品购买数量
grouped_momnth = df.groupby('month')
plt.figure(1, figsize=(10, 4))
plt.title('每月用户购买张数')
plt.ylabel('CD碟数(张)')
grouped_momnth.order_products.sum().plot()
plt.show()
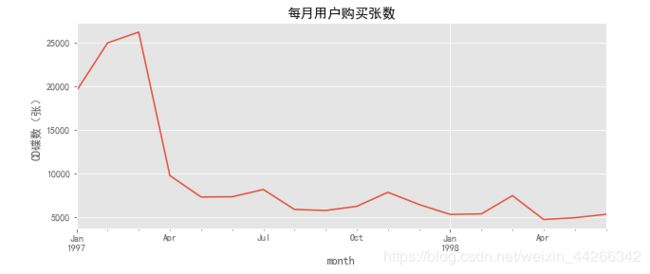
从图中可以看到,销量在前几个月异常高涨,并在3月达到最高峰,后续销量较为稳定,且有轻微下降趋势。
2.每月的消费金额
plt.figure(1, figsize=(10, 4))
plt.title('每月销售额')
plt.ylabel('销售额')
grouped_momnth.order_amount.sum().plot()
plt.show()

由图可以看到,消费金额也一样呈现早期销售多,后期平稳下降趋势,而且前三月数据都呈现出异常状态,为什么呈现这样的原因呢?我们可以假设前三个月有促销活动,或者用户本身出了问题,早期用户有异常值。但这里只有消费数据,因此不能做出判断。
3.每月消费次数
plt.figure(1, figsize=(10, 4))
plt.title('每月订单数')
plt.ylabel('订单数')
grouped_momnth.user_id.count().plot()
plt.show()
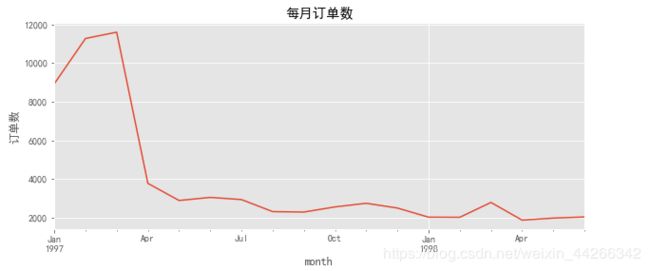
前三个月订单数在 10000 笔左右,后续月份的平均消费订单数则在 2500 笔左右。
4.每月消费人数
plt.figure(1, figsize=(10, 4))
plt.title('每月消费人数')
plt.ylabel('人数')
grouped_momnth.user_id.apply(lambda x: len(x.drop_duplicates())).plot()
plt.show()
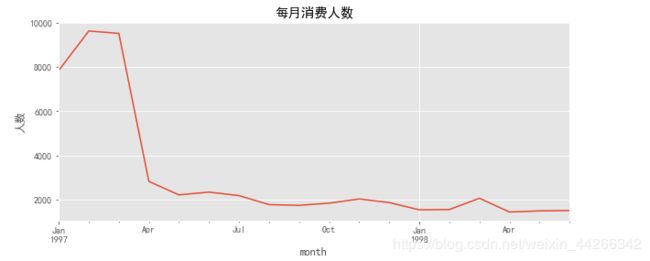
每月消费人数低于每月消费次数,但差异不大。
前三个月每月消费人数在 8000~10000 之间,后续月份,平均消费人数在 2000 人不到。
四、用户个体消费分析
- 用户消费金额,消费次数的描述统计
- 用户消费金额和购买数量散点图
- 用户消费分布图
- 用户累计消费金额的占比(百分之多少的用户占了百分之多少的消费)
1.用户消费金额,消费次数的描述统计
grouped_user = df.groupby('user_id')
- 从用户角度
- 用户数量:23570,每位用户平均购买 7 张 CD,但是中位数值只有3,且有狂热用户购买了1033 张。平均值大于中位数,是右偏分布,说明小部分用户购买了大量的 CD。
- 从消费金额角度
- 用户平均消费 106 元,中位值只有 43,且有土豪用户消费 13990,结合分位数和最大值看,平均数仅和 75 分位接近,肯定存在小部分的高频消费用户。
2.用户消费金额和购买数量的散点图
plt.figure(figsize=(12,4))
plt.subplot(121)
plt.scatter(x = 'order_amount', y = 'order_products',data=df)
plt.xlabel('每笔订单消费金额')
plt.ylabel('每笔订单购买数量')

plt.subplot(122)
plt.scatter(x = 'order_amount',y = 'order_products',
            data = grouped_user.sum())
plt.xlabel('每位用户消费金额')
plt.ylabel('每位用户购买数量')
plt.show()
- 从每笔订单的散点图观察
- 订单消费金额和订单商品有规律性,每个商品均价 10元,且订单极值较少,超出 1000 的不多,所以不是造成异常波动的原因。
- 从每位用户的消费散点图观察
- 用户比较健康,且线性关系比订单更强,由于这是 CD 网站的销售数据,商品较为单一,金额和商品的关系因此呈线性关系,离群点不多。
3.用户消费分布图
为了更好的观察消费能力极强的用户,因为数量不多,所以用直方图
plt.figure(figsize=(12, 4))
plt.subplot(121)
ax = grouped_user.order_amount.sum().hist(bins=50)
ax.set_xlabel('金额(美元)')
ax.set_ylabel('用户人数')
ax.set_xlim(0, 2000)
ax.set_title('用户消费金额分布图')

plt.subplot(122)
ax1 = grouped_user.order_products.sum().hist(bins = 50)

ax1.set_xlabel('CD 数(张)')
ax1.set_ylabel('用户人数')
ax1.set_xlim(0, 150)
ax1.set_title('购买 CD 数分布图')
plt.show()

从直方图可知,用户消费金额,绝大部分呈现集中趋势,大部分购买CD数20张内,高消费用户在图上几乎看不到,这是符合消费行为的行业规律。
4.用户累计消费金额的占比
user_cumsum = grouped_user.sum().sort_values('order_amount').apply(lambda x:x.cumsum())
user_cumsum
user_cumsum = grouped_user.sum().sort_values('order_amount').apply(lambda x:x.cumsum() / x.sum())
user_cumsum.reset_index().order_amount.tail()
# 输出
23565    0.985405
23566    0.988025
23567    0.990814
23568    0.994404
23569    1.000000
Name: order_amount, dtype: float64
user_cumsum = grouped_user.sum().sort_values('order_amount').apply(lambda x:(x.cumsum() / x.sum())*100)
user_cumsum.reset_index().order_amount.plot()
plt.title('用户累计消费金额占比')
plt.xlabel('人数')
plt.ylabel('百分比 %')
plt.show()

通过分析累计销售额占比,从图中不难看出用户消费行为基本符合二八定律,80% 的用户贡献了 25% 的消费金额,而 60% 的消费由前 5000 名用户贡献。所以只要维护了这5000 名用户,就能完成 60% 的KPI。
五、用户消费行为
- 用户第一次消费(首购)时间
- 用户最后一次消费时间
- 用户分层
- RFM (RFM模型是衡量客户价值和客户创利能力的重要工具和手段)
- 新、老、活跃、回流、流失
- 用户购买周期(按订单)
- 用户消费周期描述
- 用户消费周期分布
- 用户生命周期(按第一次&最后一次消费)
- 用户生命周期描述
- 用户生命周期分布
1.用户首购时间
grouped_user.min().month.value_counts()
# 输出
1997-02-01    8476
1997-01-01    7846
1997-03-01    7248
Name: month, dtype: int64
grouped_user.min().order_dt.value_counts().plot() # 首购
plt.show()
2.用户最后一次购买时间
grouped_user.month.max().value_counts()
# 输出
1997-02-01    4912
1997-03-01    4478
1997-01-01    4192
1998-06-01    1506
1998-05-01    1042
1998-03-01     993
1998-04-01     769
1997-04-01     677
1997-12-01     620
1997-11-01     609
1998-02-01     550
1998-01-01     514
1997-06-01     499
1997-07-01     493
1997-05-01     480
1997-10-01     455
1997-09-01     397
1997-08-01     384
Name: month, dtype: int64
grouped_user.max().order_dt.value_counts().plot() # 最后一次消费
plt.show()
- 通过以上两个维度观察,可以看出
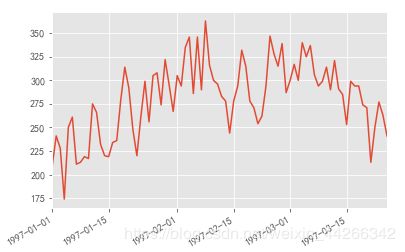
- 用户第一次购买分布,集中在前三个月,其中,在 2 月 11 日至 2 月 25 日有一次剧烈波动。
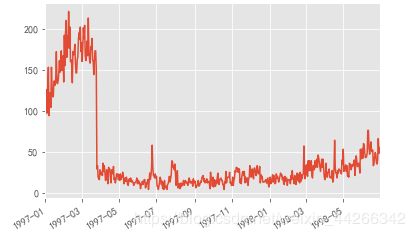
- 用户最后一次购买的分布比第一次分布广,但是大部分最后一次购买也集中在前三个月,说明忠诚用户较少,随着时间的递增,最后一次购买数在递增,消费呈现流失上升的趋势,所以可以推测,这份数据选择的是前三个月消费的用户在后面18个月的跟踪记录数据,前三个月消费金额和购买数量的异常趋势获得解释。
3.用户分层
3.1 构建RFM 模型
- Recency Frequency Monetary
rfm = df.pivot_table(index = 'user_id',
                    values = ['order_products', 'order_amount', 'order_dt'],
                    aggfunc = {'order_dt':'max',
                               'order_amount':'sum',
                               'order_products':'sum'
                              })
rfm.head()
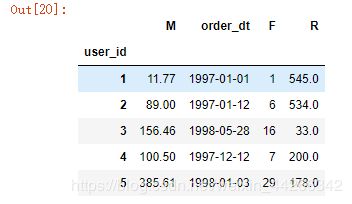
rfm['R'] = -(rfm.order_dt - rfm.order_dt.max()) / np.timedelta64(1, 'D')
rfm.rename(columns = {'order_products': 'F', 'order_amount':'M'},
                 inplace=True)
rfm.head()
def rfm_func(x):
    level = x.apply(lambda x:'1' if x>=1 else '0')
    label = level.R + level.F + level.M
    d = {
        '111':'重要价值客户',
        '011':'重要保持客户',
        '101':'重要挽留客户',
        '001':'重要发展客户',
        '110':'一般价值客户',
        '010':'一般保持客户',
        '100':'一般挽留客户',
        '000':'一般发展客户'
        }
    result = d[label]
    return result

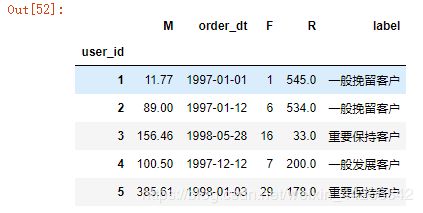
rfm['label'] = rfm[['R', 'F', 'M']].apply(lambda x:x-x.mean()).apply(rfm_func,axis=1)
rfm.head()
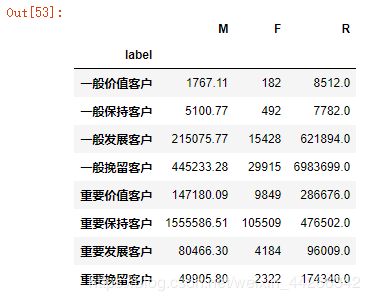
rfm.groupby('label').sum()
for label,gropued in rfm.groupby('label'):
    x= gropued['F']
    y = gropued['R']

    plt.scatter(x,y,label = label) # 利用循环绘制函数
plt.legend(loc='best') # 图例位置
plt.xlabel('Frequency')
plt.ylabel('Recency')
plt.show()

从 RFM 分层可知,大部分用户为重要保持客户,但这是因为极值存在,所以 FRM 的划分应按照业务为准划分
- 尽量用小部分的用户覆盖大部分的额度
- 不要为了数据好看而划分等级
3.2 按新、活跃、回流、流失分层用户
# 通过每月是否消费来划分用户
pivoted_counts = df.pivot_table(index = 'user_id',
                                columns = 'month',
                                values = 'order_dt',
                                aggfunc = 'count').fillna(0)
pivoted_counts.columns = df.month.sort_values().astype('str').unique()
pivoted_counts.head()
df_purchase = pivoted_counts.applymap(lambda x: 1 if x> 0 else 0)
df_purchase.tail()
def active_status(data):
    status = []
    for i in range(18):

        if data[i] == 0:
            if len(status) > 0:
                if status[i-1] == 'unreg':
                    status.append('unreg')
                else:
                    status.append('unactive')
            else:
                status.append('unreg')

        else:
            if len(status) == 0:
                status.append('new')
            else:
                if status[i-1] == 'unactive':
                    status.append('return')
                elif status[i-1] == 'unreg':
                    status.append('new')
                else:
                    status.append('active')
    return pd.Series(status,df_purchase.columns)
若本月没有消费
- 若之前未注册,则依旧未注册
- 若之前有消费,则为流失/为活跃
- 其他情况,未注册
若本月消费
- 若是第一次消费,则为新用户
- 如果之前有过消费,上个月为不活跃,则为回流
- 如果上个月未注册,则为新用户
- 除此之外,为活跃
purchase_states = df_purchase.apply(active_status,axis = 1)
purchase_states.tail()
purchase_states_ct = purchase_states.replace('unreg',np.NaN).apply(lambda x:pd.value_counts(x))
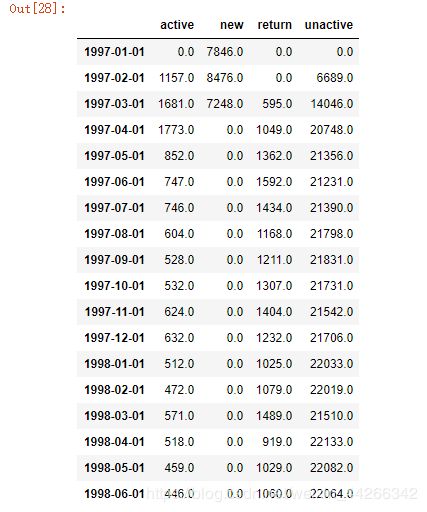
purchase_states_ct

unreg 状态排除掉,是未来才成为新用户,作为不同分呈用户每月统计量。
# 转置后方便观察
purchase_states_ct.fillna(0).T
# 绘制面积图
purchase_states_ct.fillna(0).T.plot.area(figsize = (12, 6))
plt.show()
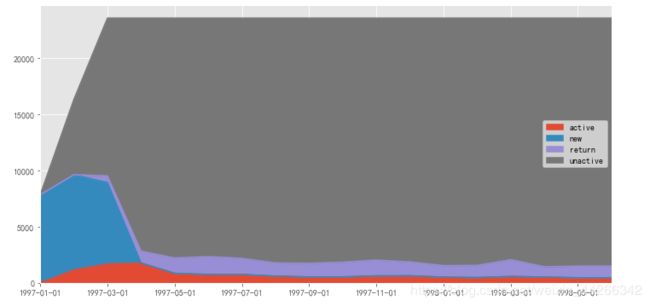
由面积图,蓝色和灰色区域占大面积,可以不看,因为这只是某段时间消费过的用户的后续行为。其次红色代表的活跃用户非常稳定,是属于核心用户,以及紫色的回流用户,这两个分层相加,就是消费用户人数占比(后期没用新客)
3.3回流用户占比
plt.figure(figsize=(20, 4))
rate = purchase_states_ct.fillna(0).T.apply(lambda x: x/x.sum())
plt.plot(rate['return'],label='return')
plt.plot(rate['active'],label='active')
plt.legend()
plt.show()
- 回流用户比:某个时间段内回流用户在总用户中的占比
- 由图可知,用户每月回流用户比占 5% ~ 8% 之间,有下降趋势,说明客户有流失倾向。
- 回流用户率:上月有多少不活跃用户在本月消费
- 由于这份数据的不活跃用户量基本不变,所以这里的回流率,也近似等于回流比
- 活跃用户比:某个时间段内活跃用户在总用户中的占比。
- 活跃用户的占比在 3% ~ 5%间,下降趋势更显著,活跃用户可以看作连续消费用户,忠诚度高于回流用农户。
结合活跃用户和回流用户看,在后期的消费用户中,60%是回流用户,40%是活跃用户,整体用户质量相对不错。也进一步说明前面用户消费行为分析中的二八定律,反应了在消费领域中,狠抓高质量用户是不变的道理。
4.用户购买周期
# 订单时间间隔
order_diff = grouped_user.apply(lambda x:x.order_dt - x.order_dt.shift())
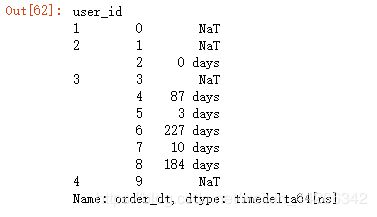
order_diff.head(10)
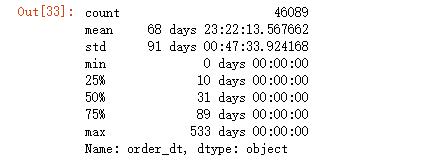
order_diff.describe()
# 订单周期分布图
(order_diff / np.timedelta64(1, 'D')).hist(bins = 20)
plt.show()
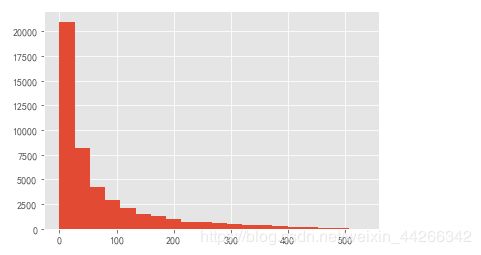
- 订单周期呈指数分布
- 用户的平均购买周期是 68 天
- 绝大部分用户的购买周期低于 100 天
- 用户生命周期图是典型的长尾图,大部分用户的消费间隔确实比较短。不妨将时间召回点设为消费后立即赠送优惠券,消费后10天询问用户CD怎么样,消费后30天提醒优惠券到期,消费后60天短信推送。
5.用户生命周期
# 最后一次购买的时间减去首购时间
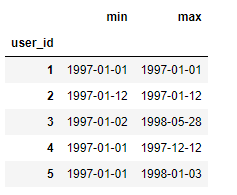
user_life = grouped_user.order_dt.agg(['min', 'max'])
user_life.head()
# 只消费过一次的用户占比
(user_life['min'] == user_life['max']).value_counts().plot.pie()
plt.show()
(user_life['max'] - user_life['min']).describe()
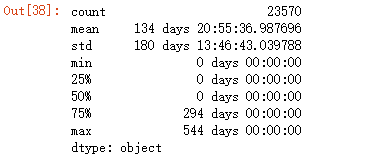
通过描述可知,用户平均生命周期 134 天,比预想高,但是平均数不靠谱,中位数 0 天,大部分用户第一次消费也是最后一次,这批属于低质量用户,而最大的是 544 天,几乎是数据集的总天数,这用户属于核心用户。
因为数据中的用户都是前三个月第一次消费,所以这里的生命周期代表的是1月~3月用户的生命周期。因为用户会持续消费,这段时间过后还会继续消费,用户的平均生命周期会增长。
plt.figure(figsize=(20, 4))
plt.subplot(121)
((user_life['max'] - user_life['min']) / np.timedelta64(1, 'D')).hist(bins = 15)
plt.title('二次消费以上用户的生命周期直方图')
plt.xlabel('天数')
plt.ylabel('人数')

# 过滤生命周期为0 的
plt.subplot(122)
u_l = ((user_life['max'] - user_life['min']).reset_index()[0] / np.timedelta64(1, 'D'))
u_l[u_l > 0].hist(bins = 40)
plt.title('二次消费以上用户的生命周期直方图')
plt.xlabel('天数')
plt.ylabel('人数')
plt.show()

通过两图对比看出,过滤掉周期为 0 的用户后,图像呈双峰结构,虽然还是有不少用户生命周期趋于 0 天,但是相比第一幅图,靠谱多了。部分低质用户,虽然消费两次,但还是不能持续消费,要想提高用户转化率,应该用户首次消费 30 天内尽量引导,少部分用户集中在 50 - 300 天,属于普通用户,忠诚度一般。集中在 400 天以后的,是高质量用户了,后期人数还在增加,这批用户已经属于核心用户了,忠诚度极高,尽量维护这批用户的利益。
# 消费两次以上用户平均生命周期
u_l[u_l > 0].mean()

# 输出
276.0448072247308
消费两次以上的用户平均生命周期是 276 天,远高于总体,所以如何在用户首次消费后引导其进行多次消费,可以有效提高用户生命周期。
六、复购率和回购率分析
- 复购率
- 自然月内,购买多次的用户占比
- 回购率
- 曾经购买的用户在某一时期内的再次购买的占比
6.1 复购率
# 消费两次及以上为 1 ,消费一次为 0 ,没有消费为空
purchase_r = pivoted_counts.applymap(lambda x: 1 if x > 1 else np.NaN if x==0 else 0)
purchase_r.head()
# 复购率折线图
(purchase_r.sum() / purchase_r.count()).plot(figsize = (10, 4))
plt.show()
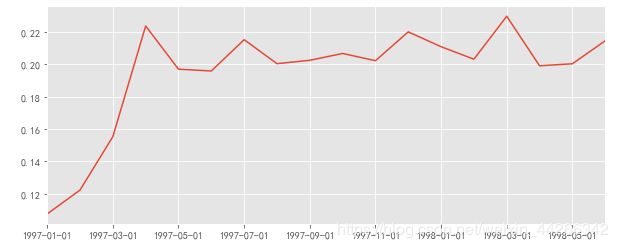
复购率稳定在 20% 左右,前三个月因为有大量新用户涌入,而这批用户只购买了一次,所以导致复购率降低。
6.2 回购率
def purchase_back(data):
    status = []
    for i in range(17):
        if data[i] == 1:
            if data[i+1] == 1:
                status.append(1)
            if data[i+1] == 0:
                status.append(0)
        else:
            status.append(np.NaN)
    status.append(np.NaN)
    return pd.Series(status,df_purchase.columns)
purchase_b = df_purchase.apply(purchase_back,axis = 1)
purchase_b.head()
1 为回购用户, 0 为上月没购买当月购买过,NaN 为连续两月都没购买
plt.figure(figsize=(20,4))
plt.subplot(211)
(purchase_b.sum() / purchase_b.count()).plot()
plt.title('用户回购率图')
plt.ylabel('百分比%')

plt.subplot(212)
plt.plot(purchase_b.sum(),label='每月消费人数')
plt.plot(purchase_b.count(),label='每月回购人数')
plt.xlabel('month')
plt.ylabel('人数')
plt.legend()
plt.show()
- 由回购率图可以看出,用户回购率高于复购率,约在 30% 左右,波动性较强。新用户回购率在 15 % 左右,与老用户相差不大。
- 由人数分布图发现,回购人数在前三月之后趋于稳定,所以波动产生的原因可能由于营销淡旺季导致,但之前复购用户的消费行为与会回购用户的行为大致相同,可能有一部分用户重合,属于优质用户。
- 结合回购率和复购率分析,可以新客的整体忠诚度低于老客,老客的回购率较好,消费频率稍低,这是 CDNow 网站的用户消费特征。
七、留存率分析
# 每一次消费距第一次消费的时间差值
user_purchase = df[['user_id','order_products','order_amount','order_dt']]
user_purchase_retention = pd.merge(left = user_purchase,
                                   right = user_life['min'].reset_index(),
                                  how = 'inner',
                                  on = 'user_id')
user_purchase_retention['order_dt_diff'] = user_purchase_retention['order_dt']-user_purchase_retention['min']
user_purchase_retention['dt_diff'] = user_purchase_retention.order_dt_diff.apply(lambda x: x/np.timedelta64(1,'D'))

user_purchase_retention.head()

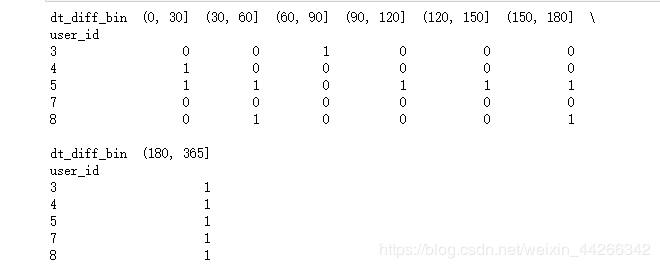
这里将时间差值分桶,代表用户当前消费时间距第一次消费属于哪个时间段。这里dt_diff = 0 并没有被划分入 0~30 天,因为计算的是留存率,如果用户仅消费了一次,留存率应该是 0。此外,如果用户第一天内消费了多次,但是往后没有消费,也算作留存率 0
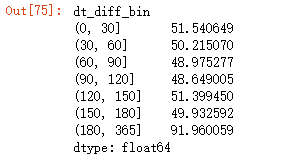
pivoted_retention.mean()
- 统计各时间段用户有消费的平均值,虽然后面时段的消费更高,但是其时间跨度也更大。从平均效果看,用户第一次消费后的 0~3 天,可能消费更多。
- 但消费多是相对的,我们要看整体中有多少用户在 0~3 天消费。
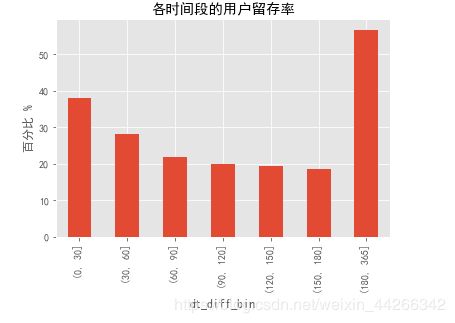
((pivoted_retention_trans.sum()/pivoted_retention_trans.count())*100).plot.bar()
plt.ylabel('百分比 %')
plt.title('各时间段的用户留存率')
plt.show()
- 第一个月的留存率达到 38%,第二个月就下降到 35% 左右,之后几个月趋于稳定,说明通过用户在前三个月的使用中,逐渐开始喜爱本店铺的业务或者转换别家的店铺,有 20% 左右的用户在第一次购买后的三个月到半年之间有过购买, 27% 左右的用户在半年后至一年内有过购买。
- 从运角度读看,与拉新相比,更应该注重用户忠诚度的培养,如果有活动,最好放在前三个月。
- 结合用户生命周期,应该放长线钓大鱼,用户平均消费时间间隔为 68 天,所以召回用户最好在 60 左右的时间间隔。


