手把手重现Science的主图Maptree
文章目录
- 手把手重现Science的主图-Maptree
- 写在前面
- 输入文件
- 开始运行
- 初步绘制maptree图形
- 按照物种分类信息上色
- 按照OTU差异进行上色
- 补充一 : ggraph版本的物种分类树
- 猜你喜欢
- 写在后面
手把手重现Science的主图-Maptree
写在前面
最近一篇Science的图表中第一幅主图使用圆堆积图(circle packing chart,是树图Treemap/Maptree的一种变体)展示,让我们惊艳到了。详见《Science:病原菌激活植物内生菌群的抑病功能》。通过宏基因组提取16S rRNA基因序列注释细菌群落并统计不同门类细菌差异,最大的圈代表门水平,逐渐缩小的圈按照梯度分别代表纲,科,属。不同颜色标记差异的微生物。这里带大家一起探索这个图表的奥秘。
其实Maptree的中文介绍似乎不多,基于R语言绘制相关图表资料较少。我当时写了两篇比较基础的maptrree绘制教程:《matree基础》;《让maptree动起来》,大家可以作为理解和初次学习使用,本次教程我将整个函数封装起来,并且定义了三个可简单使用,实现复杂格式转换,一键完成绘制maptreeR函数,相信大家可以很轻易的绘制出Science水准的maptree。
![]()
是不是很漂亮
# rm(list=ls())
#导入功能函数
source("./MaptreeForMicrobiome.R")
输入文件
文件夹内要准备至少两个文件:OTU表和物种注释
测试数据下载,请在后台回复“maptree”获取下载链接
OTU表otutab.txt格式如下:行为特征OTU/ASV,列为样本名,可以为原始值或标准化的小数均可
OTUID  KO1     KO2     KO3
ASV_1   1113    1968    816
ASV_2   1922    1227    2355
ASV_3   568     460     899
物种注释taxonomy.txt:包括OTUID和7级注释,末知的补Unassigned
OTUID   Kingdom Phylum  Class   Order   Family  Genus   Species
ASV_1   Bacteria        Actinobacteria  Actinobacteria  Actinomycetales Thermomonosporaceae     Unassigned      Unassigned
ASV_2   Bacteria        Proteobacteria  Betaproteobacteria      Burkholderiales Comamonadaceae  Pelomonas       Pelomonas_puraquae
ASV_3   Bacteria        Proteobacteria  Gammaproteobacteria     Pseudomonadales Pseudomonadaceae        Rhizobacter     Rhizobacter_bergeniae
开始运行
#导入otu表格
otu = read.delim("./otutab.txt",row.names = 1)
head(otu)
otu = as.matrix(otu)
# str(otu)
#导入注释文件
tax = read.delim("./taxonomy.txt",row.names = 1)
head(tax)
#将物种注释文件转化为矩阵,方便使用phyloseq封装
tax = as.matrix(tax)
初步绘制maptree图形
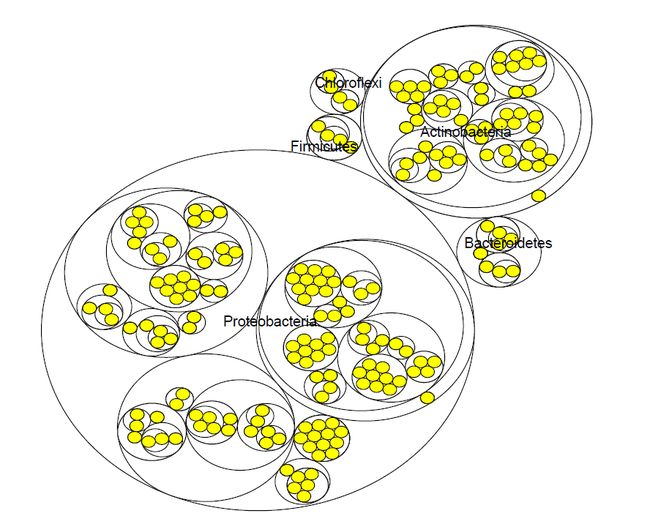
data_to_maptree 函数功能为将提供的文件转换为maptree需要的格式,并提供简单出图,参数N代表选取OTU的数量(按照丰度排序,选取丰度最高的前N个OTU做展示),这里我设置N = 200。
在 data_to_maptree 函数中我将几个结果做了封到了一个list中作为输出,
list(p,deg,vertices_t,ps_sub,mygraph):
- p:maptree图形
- deg:maptree从属关系矩阵
- vertices_t:maptree中OTU以及每层物种的全部信息矩阵
- ps_sub:phyloseq封装的做maptree的OT u信息和物种注释信息。
- mygraph:这是做maptree的网络文件,我将其作为一个输出可以让我我们很容易得到其他ggraph其他出图风格的图形。参见补充一
#基本函数,画出maptree
mapdata = data_to_maptree (otu,tax,200)
#提取图形部分并保存
p1= mapdata[[1]]
p1
ggsave("./maptree1.pdf", p1, width = 12, height =10 )
按照物种分类信息上色
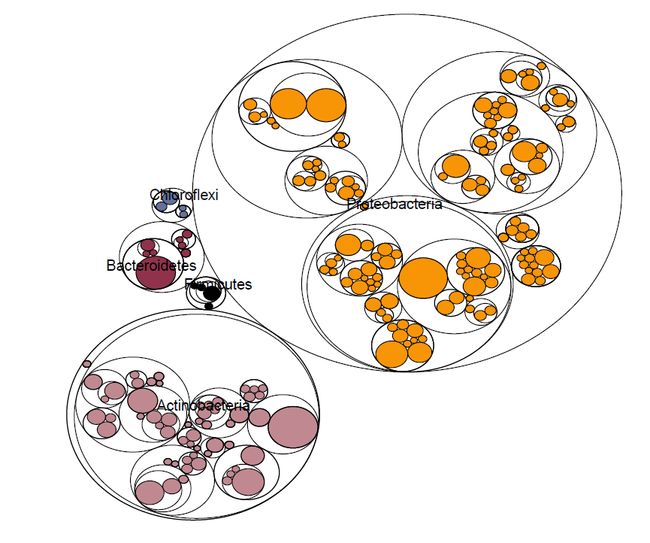
maptree_add1_plot函数承接data_to_maptree 函数,并使用data_to_maptree 函数的输出作为输入文件,并对data_to_maptree的结果进行按照门水平上色。
#按照平均丰度修改大小和按照门水平上色颜色
mapadd = maptree_add1_plot(mapdata)
p2 = mapadd[[1]]
p2
#d导出ggplot对象的优点就是可以随心所欲的修改图形上的内容
p2 +scale_fill_brewer()
# p2 + scale_color_gradient2()

ggsave("./maptree.pdf", p2, width = 12, height =10)
按照OTU差异进行上色
这里我们导入OTU差异分析完成后的表格
#差异表达文件
addtab = read.delim("./KO-WT_all.txt",row.names = 1)

head(addtab)
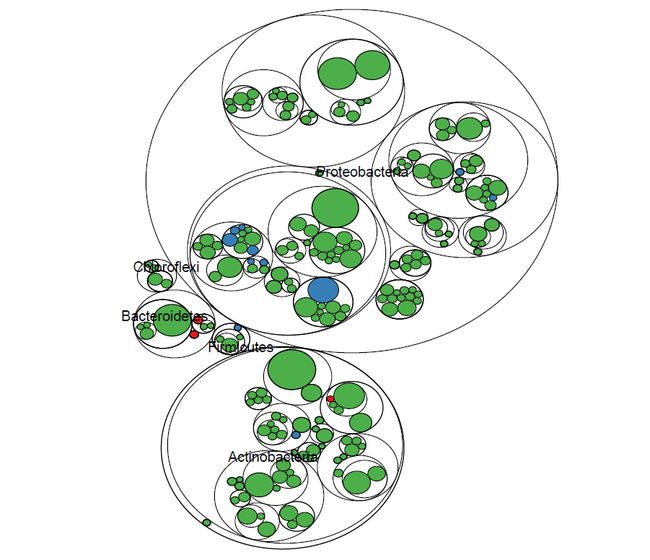
maptree_add2_plot函数承接data_to_maptree 函数,但是填充颜色已经从门变成了自定义列,这也将大大方便我们的实际研究,例如:使用差异分析结果进行上色。
#按照指定列上色
mapadd2 = maptree_add2_plot(mapdata,fillcolor = "level")
#提取作图文件
p3 = mapadd2[[1]]
p3

# p3 +scale_fill_brewer()

ggsave("./maptree3.pdf", p3, width = 12, height =10)
补充一 : ggraph版本的物种分类树
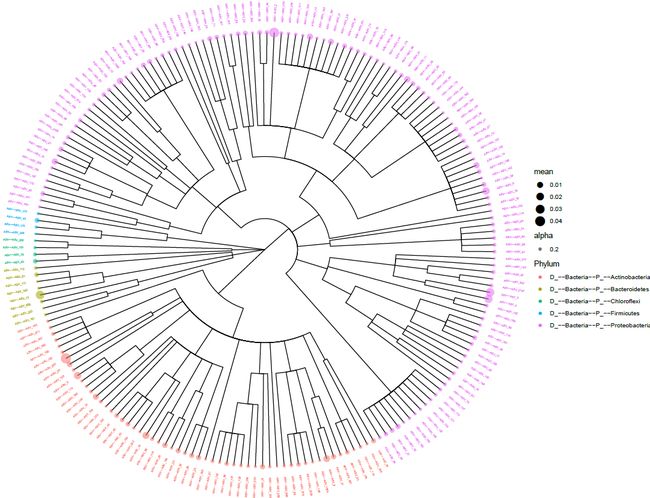
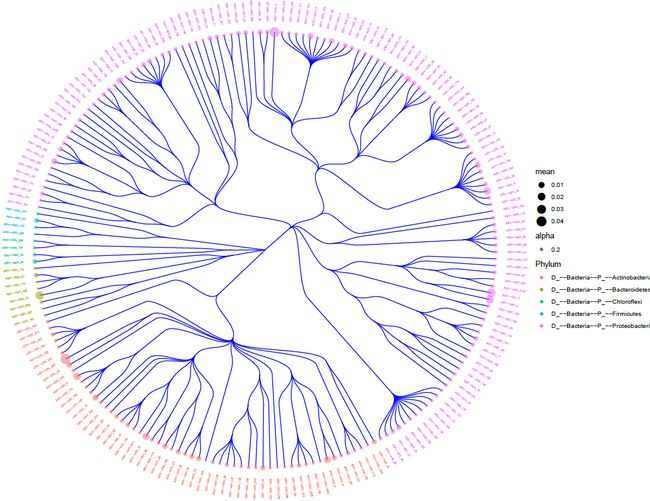
我们造的轮子在ggraph包中还可以做一些有意思的图形,这里我就本次数据结合ggraph的layout做一个简单的优化展示,为大家带来ggraph版本的物种分类树
graph = mapadd[[2]]

#展示物种分类关系
ggraph(graph, 'dendrogram', circular = TRUE) +
  geom_edge_elbow() +
   scale_edge_colour_distiller(palette = "RdPu") +
  geom_node_point(aes( x = x, y=y, filter = leaf,size=mean,colour=Phylum, alpha=0.2)) +
  geom_node_text(aes(x = x*1.05, y=y*1.05, filter = leaf, label=name,
   hjust='outward', angle = -((-node_angle(x, y)+90)%%180)+90, size=3,
   colour=Phylum), size=0.8, alpha=1)  + theme_void()
graph = mapadd[[2]]

# data = create_layout(graph, layout = 'dendrogram', circular = TRUE)
# head(data)

#展示为无数种分类树,这种方式也是我知道
ggraph(graph, layout = 'dendrogram', circular = TRUE) +
   geom_edge_diagonal(colour="blue") +
   scale_edge_colour_distiller(palette = "RdPu") +
  geom_node_point(aes( x = x, y=y, filter = leaf,size=mean,colour=Phylum, alpha=0.2)) +
  geom_node_text(aes(x = x*1.05, y=y*1.05, filter = leaf, label=name,
   hjust='outward', angle = -((-node_angle(x, y)+90)%%180)+90, size=3,
   colour=Phylum), size=0.5, alpha=1)  + theme_void()
这是我运行的环境
sessionInfo()
## R version 3.6.1 (2019-07-05)
## Platform: x86_64-w64-mingw32/x64 (64-bit)
## Running under: Windows 10 x64 (build 18362)
##
## Matrix products: default
##
## locale:
## [1] LC_COLLATE=Chinese (Simplified)_China.936
## [2] LC_CTYPE=Chinese (Simplified)_China.936
## [3] LC_MONETARY=Chinese (Simplified)_China.936
## [4] LC_NUMERIC=C
## [5] LC_TIME=Chinese (Simplified)_China.936
##
## attached base packages:
## [1] stats     graphics  grDevices utils     datasets  methods   base
##
## other attached packages:
##  [1] RColorBrewer_1.1-2 ggtree_1.14.6      phyloseq_1.28.0
##  [4] data.tree_0.7.11   viridis_0.5.1      viridisLite_0.3.0
##  [7] forcats_0.4.0      stringr_1.4.0      dplyr_0.8.3
## [10] purrr_0.3.2        readr_1.3.1        tidyr_0.8.3
## [13] tibble_2.1.3       tidyverse_1.2.1    ggraph_2.0.0
## [16] ggplot2_3.2.1.9000 igraph_1.2.4.1
##
## loaded via a namespace (and not attached):
##  [1] nlme_3.1-140        lubridate_1.7.4     httr_1.4.0
##  [4] tools_3.6.1         backports_1.1.5     vegan_2.5-5
##  [7] R6_2.4.1            lazyeval_0.2.2      mgcv_1.8-28
## [10] BiocGenerics_0.30.0 colorspace_1.4-1    permute_0.9-5
## [13] ade4_1.7-13         withr_2.1.2         tidyselect_0.2.5
## [16] gridExtra_2.3       compiler_3.6.1      cli_1.1.0
## [19] rvest_0.3.5         Biobase_2.44.0      xml2_1.2.0
## [22] labeling_0.3        scales_1.1.0        digest_0.6.23
## [25] rmarkdown_1.15      XVector_0.24.0      pkgconfig_2.0.2
## [28] htmltools_0.3.6     rlang_0.4.2         readxl_1.3.1
## [31] rstudioapi_0.10     farver_2.0.1        generics_0.0.2
## [34] jsonlite_1.6        magrittr_1.5        biomformat_1.12.0
## [37] Matrix_1.2-17       Rcpp_1.0.3          munsell_0.5.0
## [40] S4Vectors_0.22.0    Rhdf5lib_1.6.0      ape_5.3
## [43] lifecycle_0.1.0     stringi_1.4.3       yaml_2.2.0
## [46] MASS_7.3-51.4       zlibbioc_1.30.0     rhdf5_2.28.0
## [49] plyr_1.8.4          grid_3.6.1          parallel_3.6.1
## [52] ggrepel_0.8.1       crayon_1.3.4        lattice_0.20-38
## [55] splines_3.6.1       graphlayouts_0.5.0  Biostrings_2.52.0
## [58] haven_2.1.1         multtest_2.40.0     hms_0.5.0
## [61] zeallot_0.1.0       knitr_1.23          pillar_1.4.2
## [64] reshape2_1.4.3      codetools_0.2-16    stats4_3.6.1
## [67] glue_1.3.1          evaluate_0.14       data.table_1.12.2
## [70] modelr_0.1.4        treeio_1.6.2        vctrs_0.2.0
## [73] tweenr_1.0.1        foreach_1.4.4       cellranger_1.1.0
## [76] gtable_0.3.0        polyclip_1.10-0     assertthat_0.2.1
## [79] xfun_0.9            ggforce_0.3.1       broom_0.5.2
## [82] tidygraph_1.1.2     tidytree_0.2.4      survival_2.44-1.1
## [85] rvcheck_0.1.3       iterators_1.0.10    IRanges_2.18.1
## [88] cluster_2.1.0
撰文:文涛,南京农业大学
责编:刘永鑫,中科院遗传发育所
猜你喜欢
- 10000+: 菌群分析
宝宝与猫狗 提DNA发Nature 实验分析谁对结果影响大 Cell微生物专刊 肠道指挥大脑 - 系列教程:微生物组入门 Biostar 微生物组 宏基因组
- 专业技能:生信宝典 学术图表 高分文章 不可或缺的人
- 一文读懂:宏基因组 寄生虫益处 进化树
- 必备技能:提问 搜索 Endnote
- 文献阅读 热心肠 SemanticScholar Geenmedical
- 扩增子分析:图表解读 分析流程 统计绘图
- 16S功能预测 PICRUSt FAPROTAX Bugbase Tax4Fun
- 在线工具:16S预测培养基 生信绘图
- 科研经验:云笔记 云协作 公众号
- 编程模板: Shell R Perl
- 生物科普: 肠道细菌 人体上的生命 生命大跃进 细胞暗战 人体奥秘
写在后面
为鼓励读者交流、快速解决科研困难,我们建立了“宏基因组”专业讨论群,目前己有国内外5000+ 一线科研人员加入。参与讨论,获得专业解答,欢迎分享此文至朋友圈,并扫码加主编好友带你入群,务必备注“姓名-单位-研究方向-职称/年级”。技术问题寻求帮助,首先阅读《如何优雅的提问》学习解决问题思路,仍末解决群内讨论,问题不私聊,帮助同行。
![]()
学习扩增子、宏基因组科研思路和分析实战,关注“宏基因组”
![]()
![]()
点击阅读原文,跳转最新文章目录阅读
https://mp.weixin.qq.com/s/5jQspEvH5_4Xmart22gjMA
