如何使用JITWatch分析JIT compiler log
关于JIT的介绍,可查看链接:
http://www.importnew.com/5270.html
Why it rocks to finally understand Java JIT with JITWatch
Performance is a complicated matter, especially if you take into account that your Java program gets through multiple rewrites during the compilation process. First, your source code is translated quite straightforwardly to bytecode, which is then compiled further, sometimes multiple times, to machine code.
And sometimes your software is just not fast enough. Then you blame your platform and your tools, and consider rewriting the important bits of your system in C or other forms of heresy. However, before you join the dark side, look around: there are tools that can help you without making you leave the comfort of the JVM.
By leveraging your knowledge of JVM internals and how the JIT compiler works, you can optimise (to a certain extent) your code to perform better. Today we won’t talk about the optimisations themselves. If you’re really interested in that more than anything else, check out for example how HikariCP is optimized. So instead we’ll talk about a tool called JITWatch that can give you some insight about how your application is handled by the JIT.
Enter JITWatch
JITWatch is a log analyser for Java HotSpot JIT compiler. It consumes JIT log files and visualizes its activity. The project was originally started by Chris Newland, but later was donated (thanks Chris!) to the Adopt OpenJDK initiative.
This is an invaluable resource when you want to understand what happens to your code when the JVM crunches it or when you start tuning your JVM parameters to squeeze the performance out of the virtual machine.
Among other features, it can supply you with the simultaneous source code, bytecode and machine code/assembly view of your application, so not only can you get smarter about your app performance bottlenecks, but also, for example, avoid messing with the command line javap. Modern tools make our life easier and in this post, we’ll look into configuring JITWatch for a sample project and investigate what happens on its startup.
Getting started with JITWatch
Let’s first get the JITWatch executable. Luckily, like every self-respecting software, JITWatch is available from Github and the head build is passing, which means we can just go and clone it.
git clone [email protected]:AdoptOpenJDK/jitwatch.git
cd jitwatch
mvn clean install -DskipTests=true
./launchUI.sh # make sure that line-endings are correct :)
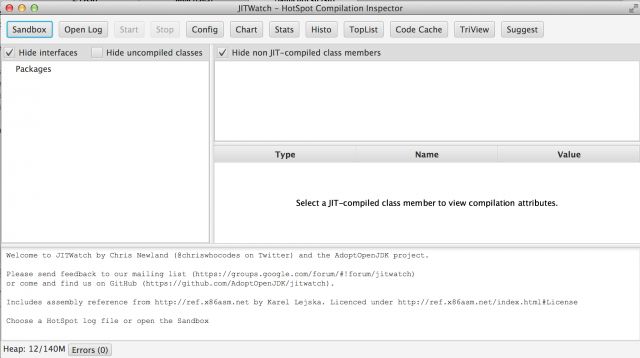
When this is done, you should be greeted by the following nice UI.
Great, now we need to figure out what application do we want to investigate.
Here’s our guinea pig to run experiments against
We want every blogpost be useful in more that one way, so immediately we face the question:
What project could we run the demo on, so it would represent an average application Java developers work on?
According to our Java Tools and Technology report a majority of us work on web applications and deploy them to Tomcats. It happens that we have a sample web-application lying around. Yes, you guessed correctly, it is the famous Spring Petclinic that has been used for ages as a JRebel demo app.
Here’s the Github repository, if you want to clone and tinker with it yourself. Luckily, it comes with batteries included, so we don’t have to change anything in order to run it.
mvn tomcat:run
executed in the petclinic parent directory will do everything necessary and spawn a Tomcat with the application deployed. Which is exactly what we wanted.
Cooking the app
Now in order to produce a hotspot.log to be analyzed, we need to add a pinch of JVM options to the process running our sample app.
Here’s what JITWatch wiki page suggests is necessary:
-XX:+UnlockDiagnosticVMOptions -XX:+TraceClassLoading -XX:+LogCompilation -XX:+PrintAssembly
Now the most straightforward approach to add all those options to the embedded Tomcat process is to add them directly to Maven itself. Just execute:
export "MAVEN_OPTS=$MAVEN_OPTS -XX:+UnlockDiagnosticVMOptions -XX:+TraceClassLoading -XX:+LogCompilation -XX:+PrintAssembly"
When your JDK complains that “PrintAssembly is disabled”, go and obtain yourself a copy of hsdis for Windows, Linux, OSX.
Ready, set, go!
One mvn tomcat:run later and we have a hotspot_pid${pid}.log file, where ${pid} is the JVM process id, in the parent directory of the petclinic project.
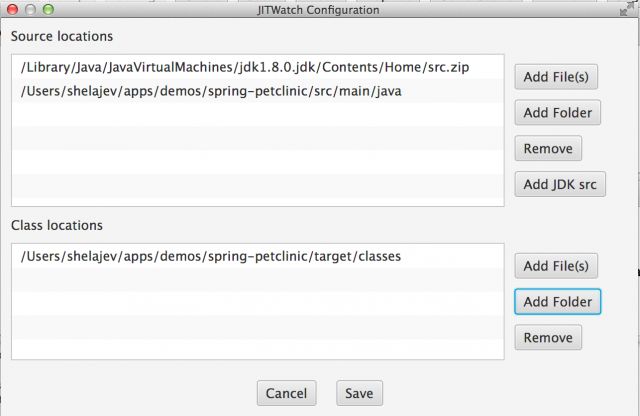
Click on the Config button to attach the sources and the location of class files to make your experience more pleasant. The Add JDK src button will automatically add the path to JDK sources for you, so definitely click on it as well.
Now start the analysis and wait a bit for JITWatch to figure things out.
Some extra, cool features
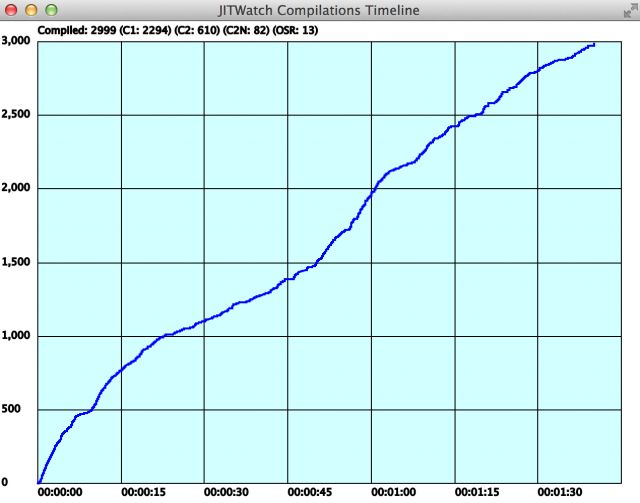
Now what can you tell from the information that JITWatch provides you? First of all, there’s a compilation timeline graph. For me it says that I have to wait more than a minute to get the basic classes compiled: and note that we didn’t apply any load to the application, so our user-defined classes won’t be compiled yet.
The next immediately useful thing is a Largest Bytecode Methods toplist. The smaller the method is the more chances there are that JIT will decide to inline it. So having huge methods not only decreases readability, but also adds to performance overhead. This view can name outright the classes and method you want to split.
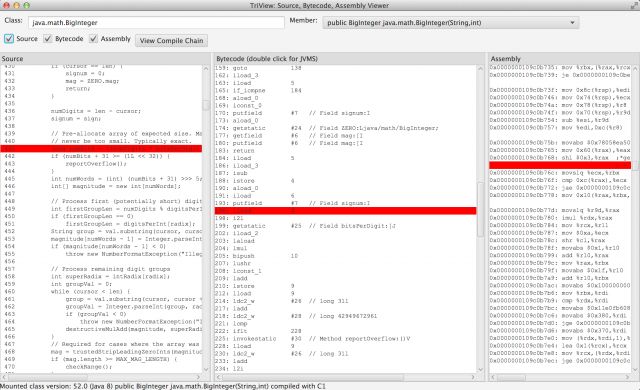
And then, of course, the TriView can give you the best insight into what is actually executed by the machine here. Below is the example of the TriView showing a BigInteger(String, int) constructor compilation with a simultaneous highlightning on all three panes.
If the method you’re interested in hasn’t been compiled yet, JITWatch will notify you about that and you can always generate some more load for your application or lower the thresholds for JIT so it will treat the method as hot enough to compile.
Final words: use JITWatch for greater insight on the performance, load and speed of your app
We’ve peeked at how JVM JIT compiles bytecode into the machine code and setup a sample project that you can experiment on. In fact, this is a very straightforward tool that can give you visual insight into what happens in your Java application.
If you want to get more fluent at reading JVM bytecode, I can recommend our Mastering Java Bytecode report by JRebel product lead, Anton Arhipov himself.
If you have any comments or suggestions how to get more info about the internals of JIT processing in the JVM, please spill it into the comments below. Or find me on Twitter: @shelajev and I’ll do that for you.


