使用 bizcharts 在react中、AntDesign中实现图表(柱状图、折线图、饼图等)
(1)安装依赖:
npm install bizcharts --save
npm install @antv/data-set
(2)图表构成的使用
(3)完整代码:
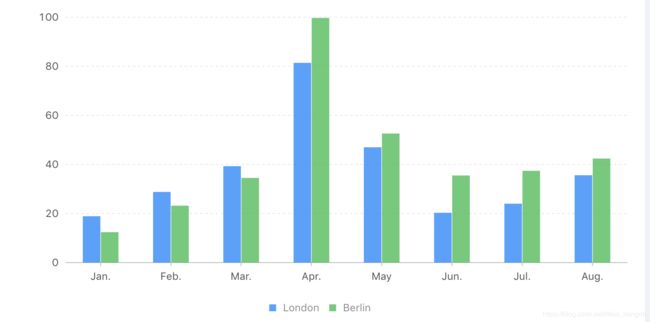
【柱状图】
import React, { Component } from 'react';
import {
    Chart,
    Geom,
    Axis,
    Tooltip,
    Legend,
} from "bizcharts";
import DataSet from "@antv/data-set";


/**
 * 使用bizCharts完成图表
 */
class Line1 extends Component {

    render() {
        const data = [
            {
                name: "London",
                "Jan.": 18.9,
                "Feb.": 28.8,
                "Mar.": 39.3,
                "Apr.": 81.4,
                May: 47,
                "Jun.": 20.3,
                "Jul.": 24,
                "Aug.": 35.6
            },
            {
                name: "Berlin",
                "Jan.": 12.4,
                "Feb.": 23.2,
                "Mar.": 34.5,
                "Apr.": 99.7,
                May: 52.6,
                "Jun.": 35.5,
                "Jul.": 37.4,
                "Aug.": 42.4
            }
        ];
        const ds = new DataSet();
        const dv = ds.createView().source(data);
        dv.transform({
            type: "fold",
            fields: ["Jan.", "Feb.", "Mar.", "Apr.", "May", "Jun.", "Jul.", "Aug."],
            // 展开字段集
            key: "月份",
            // key字段
            value: "月均降雨量" // value字段
        });
        return (


        )
    }
}
export default Line1;
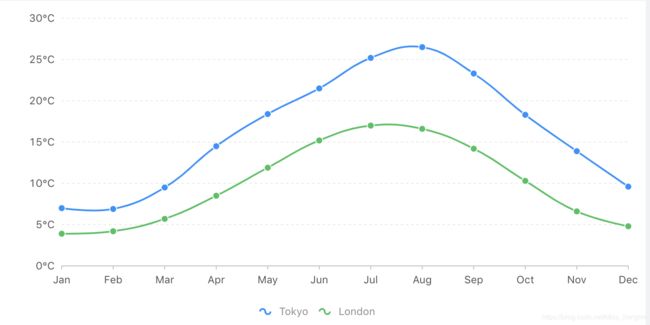
【折线图】:
import React, { Component } from 'react';
import {
    Chart,
    Geom,
    Axis,
    Tooltip,
    Legend,
} from "bizcharts";
import DataSet from "@antv/data-set";


/**
 * 使用bizCharts完成图表
 */
class Line1 extends Component {

    render() {
        const data = [
            {
                month: "Jan",
                city: "Tokyo",
                temperature: 7
            },
            {
                month: "Jan",
                city: "London",
                temperature: 3.9
            },
            {
                month: "Feb",
                city: "Tokyo",
                temperature: 6.9
            },
            {
                month: "Feb",
                city: "London",
                temperature: 4.2
            },
            {
                month: "Mar",
                city: "Tokyo",
                temperature: 9.5
            },
            {
                month: "Mar",
                city: "London",
                temperature: 5.7
            },
            {
                month: "Apr",
                city: "Tokyo",
                temperature: 14.5
            },
            {
                month: "Apr",
                city: "London",
                temperature: 8.5
            },
            {
                month: "May",
                city: "Tokyo",
                temperature: 18.4
            },
            {
                month: "May",
                city: "London",
                temperature: 11.9
            },
            {
                month: "Jun",
                city: "Tokyo",
                temperature: 21.5
            },
            {
                month: "Jun",
                city: "London",
                temperature: 15.2
            },
            {
                month: "Jul",
                city: "Tokyo",
                temperature: 25.2
            },
            {
                month: "Jul",
                city: "London",
                temperature: 17
            },
            {
                month: "Aug",
                city: "Tokyo",
                temperature: 26.5
            },
            {
                month: "Aug",
                city: "London",
                temperature: 16.6
            },
            {
                month: "Sep",
                city: "Tokyo",
                temperature: 23.3
            },
            {
                month: "Sep",
                city: "London",
                temperature: 14.2
            },
            {
                month: "Oct",
                city: "Tokyo",
                temperature: 18.3
            },
            {
                month: "Oct",
                city: "London",
                temperature: 10.3
            },
            {
                month: "Nov",
                city: "Tokyo",
                temperature: 13.9
            },
            {
                month: "Nov",
                city: "London",
                temperature: 6.6
            },
            {
                month: "Dec",
                city: "Tokyo",
                temperature: 9.6
            },
            {
                month: "Dec",
                city: "London",
                temperature: 4.8
            }
        ];
        const cols = {
            month: {
                range: [0, 1]
            }
        };
        return (


                     `${val}°C`
                        }}
                    />


        )
    }
}
export default Line1;
-------完。以上图表是使用 bizcharts 来完成的。
更多详细的文档,查看bizcharts官网。

