MATLAB编写的读取.mat文件数据并画曲线图的gui程序
matlab编写的读取sd卡数据的gui程序
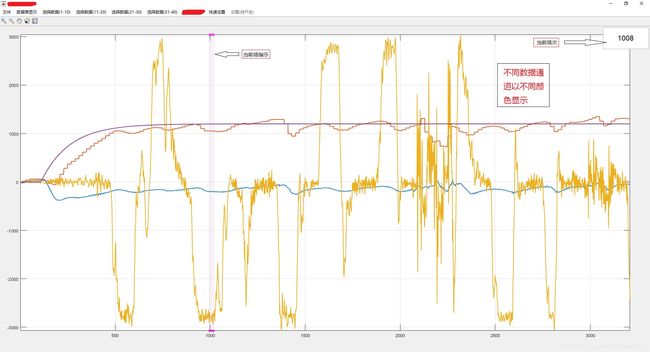
界面截图:

打开文件界面:
导入数据后截图:
是不是高端大气上档次,不要急,慢慢往下看,后面更精彩,代码会贴出来的。
显示曲线图的同时显示各种数据表


其他额外功能:
两个或以上通道数据做算术运算,借助matlab强大的矩阵计算能力,几行代码搞定。
代码:
打开文件:
function opendata_1_Callback(hObject, eventdata, handles)
global datadata data_gtime
global pathname filename
[filename,pathname,filterindex]=uigetfile('*.mat','打开数据');
if(filterindex==1)
	location=strcat(pathname,filename);
	datadata=importdata(location);
	data_gtime=0:(length(datadata(:,1))-1);
	set(handles.gtime,'String',data_gtime(1));
	refresh_Callback(hObject, eventdata, handles);
	updatepic_Callback(hObject, eventdata, handles);
end
set(handles.set,'enable','on');
这几行代码读入的mat文件需要一定的格式,本篇只讲matlab程序。如果读者想要读取自己的mat文件,可以重写这段代码。
保存文件
function savedata_Callback(hObject, eventdata, handles)
global datadata
global pathname filename
[filename,pathname,filterindex]=uiputfile('*.mat','存储数据','数据.mat');
% msgbox(['You selected ', fullfile(pathname, filename)]);
if(filterindex==1)
	save([pathname,filename],'datadata');
end
set(handles.set,'enable','off');
因为我的程序设定要从sd卡读数据,当数据读到后sd卡可能再去采集数据,所以读入sd卡数据后需要保存下来。这里注意保存的数据格式和打开的数据格式原则上应当是一致的,以免给自己带来不必要的麻烦。
关于读取sd卡数据的问题,由于内容较多,考虑另写一篇单独介绍。写好后会把链接贴进来。
显示某一通道
以1通道为例,首先更改显示状态:
function Channel1_Callback(hObject, eventdata, handles)
global isdatashow
if(strcmp(get(handles.Channel1,'Check'),'on'))
	set(handles.Channel1,'Check','off')
	isdatashow(1)=0;
else
	set(handles.Channel1,'Check','on')
	isdatashow(1)=1;
end
updatepic_Callback(hObject, eventdata, handles);
%isdatashow(1)=1代表显示1通道,=0代表隐藏1通道。
然后在画图函数中判断是否需要显示:
% 画图
for i=1:ltable(1)
    if (isdatashow(i))
        plot(handles.pic,data_gtime,datatable_data(i,:));
        hold on;
        grid on;

        if (ymaxmin(datatable_data(i,picstart:picend)))
            ymin=min(datatable_data(i,picstart:picend));
        end
    end
end
%ymax和ymin代表当前显示的数据的上下限,用以确定画图界限。
显示3条场次指示竖线:
if (isempty(get(handles.pic,'Children'))~=1)
    set(get(handles.pic,'children'),'LineWidth',1.5);
    y=get(handles.pic,'Ylim');
    x=data_gtime(linenumt);
    plot(handles.pic,[x x],y,':m*');
    plot(handles.pic,[(x-10) (x-10)],y,':m*');
    plot(handles.pic,[(x+10) (x+10)],y,':m*');
end
键盘按键操作
function figure1_WindowKeyPressFcn(hObject, eventdata, handles)
global data_gtime
global linenumt xlength
%xlength代表显示区域长度,其大小变化表现在图像缩放。data_gtime是显示区域中间横坐标,其大小变化表现在图像平移。
if (isempty(get(handles.gtime,'String'))==0)%非空执行
    if (get(gcf,'CurrentCharacter')=='D')|(get(gcf,'CurrentCharacter')=='d') %d&D
        temp=str2double(get(handles.gtime,'String'));
        if(temp20)
            set(handles.gtime,'String',temp-xlength/50);
        else
            set(handles.gtime,'String',temp);
        end
        updatepic_Callback(hObject, eventdata, handles);
    end
    if (get(gcf,'CurrentCharacter')=='S')|(get(gcf,'CurrentCharacter')=='s')
        if ((linenumt+xlength+200)0)
            xlength=xlength-200;
            updatepic_Callback(hObject, eventdata, handles)
        end
    end
end
进行显示区域的缩放和平移。
最重要的函数updatepic_Callback
大家会发现上面所以函数执行完都会调用一个叫updatepic_Callback的函数,就是更新图像函数。做的更改需要刷新图像才能看到效果。
function updatepic_Callback(hObject, eventdata, handles)
global data_gtime datatable_data AD_data flag_data
global linenumt timeselect xlength
global timeselect_last
global isdatashow isadshow
%%清除上一次图像
cla(handles.pic)
%% 时间值
if (isempty(get(handles.gtime,'String'))==0)%gtime非空执行
    timeselect=str2double(get(handles.gtime,'String'));%获得时间设定值
    if (timeselect>data_gtime(length(data_gtime)))||(timeselectlength(data_gtime)%图显10s的曲线
        picend=length(data_gtime);
    else
        picend=linenumt+xlength;
    end
    if (linenumt-xlength)<0
        picstart=1;
    else
        picstart=linenumt-xlength;
    end
    ymax=-1000000;ymin=1000000;

    % 画图
    for i=1:ltable(1)  %ltable(1)
        if (isdatashow(i))
            plot(handles.pic,data_gtime,datatable_data(i,:));
            hold on;
            grid on;

            if (ymaxmin(datatable_data(i,picstart:picend)))
                ymin=min(datatable_data(i,picstart:picend));
            end
        end
    end

    for i=1:lAD(1) %lAD(1)
        if (isadshow(i))
            plot(handles.pic,data_gtime,AD_data(i,:),'lineStyle','-.');
            hold on;
            if ymaxmin(AD_data(i,picstart:picend))
                ymin=min(AD_data(i,picstart:picend));
            end
        end
    end
    if(isempty(picstart))
        picstart=0;
    end
    if(isempty(picend))
        picend=length(data_gtime);
    end
    if(isempty(ymin))
        ymin=0;
    end
    if(isempty(ymax))
        ymax=5000;
    end
    if ymax==-1000000
        ymax=5000;
    end
    if ymin==1000000;
        ymin=0;
    end
    if(ymax==0&&ymin==0)
        ymax=100;
        ymin=-100;
    end

    set(handles.pic,'Xlim',[picstart,picend]);
    set(handles.pic,'Ylim',[ymin,ymax]);

    delete(findall(handles.pic,'LineStyle',':','Marker','*'));
    if (isempty(get(handles.pic,'Children'))~=1)
        set(get(handles.pic,'children'),'LineWidth',1.5);
        y=get(handles.pic,'Ylim');
        x=data_gtime(linenumt);
        plot(handles.pic,[x x],y,':m*');
        plot(handles.pic,[(x-10) (x-10)],y,':m*');
        plot(handles.pic,[(x+10) (x+10)],y,':m*');
    end
    timeselect_last=timeselect;
end
grid on;
几点说明
本篇提供的图片有很多关键地方被屏蔽了,是因为实验室规定如此,防止泄密。请读者谅解。
这样大篇粘代码的文章确实不是我想做的,这样做只是为了方便初学者。对于真正想学东西的,我的这点内容肯定不够,如果这篇文章成功指引你找到了解决问题的技术突破方案,那是我的荣幸。我的目的是授之以“渔”,而不是授之以“鱼”。