matlab第三次作业整理
1、分别绘制,![]() 的三维图和等高线
的三维图和等高线
x=-2*pi:0.1:2*pi;

y=-2*pi:0.1:2*pi;

[x1,y1]=meshgrid(x,y);

z1=x1.*y1+eps;

subplot(2,2,1);

mesh(x1,y1,z1)

subplot(2,2,2)

contour(x1,y1,z1,10)

z2=sin(x1.*y1)+eps;

subplot(2,2,3);

mesh(x1,y1,z2)

subplot(2,2,4);

contour3(x1,y1,z2,10)
2、选取合适的θ,绘制下面的极坐标图形:![]()
t=0:0.1:2*pi;
p=cos(2.*t/2);
subplot(1,3,1);
polar(t,p)
p1=sin(t)./t;
subplot(1,3,2);
polar(t,p1)
p2=1-(cos(7*t)).^3;
subplot(1,3,3);
polar(t,p2)
3、绘制z=sin(xy)的表面图,并剪切![]() 的部分。
的部分。
x=-2:0.1:2;
y=-2:0.1:2;
[x1,y1]=meshgrid(x,y);
z=sin(x1.*y1);
subplot(1,2,1);
mesh(x1,y1,z)
z1=sin(x1.*y1).*(x.*x+y.*y<=0.25);
subplot(1,2,2);
colormap summer
mesh(x1,y1,z1)
4、绘制三维曲面图![]() ,并进行插值着色处理,裁掉图中x和y都小于0的部分。
,并进行插值着色处理,裁掉图中x和y都小于0的部分。
x=-2:0.1:2;
y=-2:0.1:2;
[x1,y1]=meshgrid(x,y);
z=cos(x1)*cos(y1)*exp(-sqrt(x1.^2+y1.^2)/4);
subplot(1,2,1);
surf(x1,y1,z)
shading interp;
z1=z.*(x1>0).*(y1>0);
subplot(1,2,2);
mesh(x1,y1,z1)
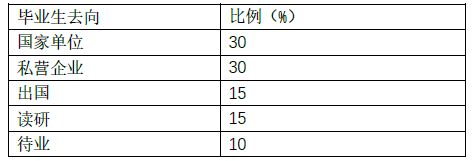
5、绘制如下数据的二维和三维饼形图:
并将私营企业和出国两部分进行突出显示。
X=[30 30 15 15 10];
subplot(1,2,1);
pie(X,[0 1 1 0 0],{'国家单位30%' '私营企业30%' '出国15%' '读研15%' '待业10%'})
subplot(1,2,2);
pie3(X,[0 1 1 0 0],{'国家单位30%' '私营企业30%' '出国15%' '读研15%' '待业10%'})