住房月租金预测大数据赛个人总结
住房月租金预测大数据赛个人总结
- 导入库
- 读取数据
- 数据分析
- 数据分布
- 统计描述
- 相关性分析
- 统计量分析
- 异常值处理
- 重复数据处理
- 缺失值处理
- 数据变换
- 将位置和区为空的数据分离开来,做两部分处理
- 特征工程(重点!)
- baseline(xgboost模型)
- 原始特征丢弃尝试
- 根据有序特征进行聚类,构造无监督特征
- rank-encoding/mean-encoding
- 依据领域知识构建特征:
- 特征选择
- catboost模型
- 调参
- 模型融合(重要上分手段)
记录、总结.比赛之前对于机器学习的步骤了解的其实并不是很清晰,借这次比赛学习一下特征工程。(注:这里只用到了部分代码,做分析思路和实现方法列举之用,且有些用到的数据集不一样。)
赛后的学习是很重要的,感谢@Trigger的开源,研二的学长,也是这次的第一名,从他的代码里学到了很多。附Github链接https://github.com/Daya-Jin/rental-prediction A榜1.80 B榜1.72
编程环境:python3.6
赛题链接: http://www.dcjingsai.com/common/cmpt/住房月租金预测大数据赛(付费竞赛)_竞赛信息.html
赛题说明:基于租房市场的痛点,提供脱敏处理后的真实租房市场数据。选手需要利用有月租金标签的历史数据建立模型,实现基于房屋基本信息的住房月租金预测,为该城市租房市场提供客观衡量标准。
数据:

导入库
# Project packages
import pandas as pd
import numpy as np

# Visualisations
import matplotlib.pyplot as plt
import seaborn as sns

# Statistics
from scipy import stats
from scipy.stats import norm, skew
from statistics import mode
from sklearn.model_selection import KFold, cross_val_score, train_test_split
from sklearn.metrics import mean_squared_error
from sklearn.model_selection import GridSearchCV
from catboost import Pool, CatBoostRegressor, cv

import sys
import warnings

if not sys.warnoptions:
    warnings.simplefilter("ignore")

from IPython.core.interactiveshell import InteractiveShell
InteractiveShell.ast_node_interactivity = "all"
#显示所有结果
plt.rcParams['font.sans-serif']=['SimHei']
plt.rcParams['axes.unicode_minus']=False
读取数据
train = pd.read_csv('train.csv')
test = pd.read_csv('test.csv')
train.head(5)
test_ID = test['id']

# Now drop the 'Id' colum since it's unnecessary for the prediction process
y_train = train['月租金']
test.drop("id", axis = 1, inplace = True)
数据分析
train.describe()
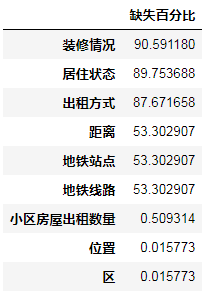
train_missing = (train.isnull().sum()/len(train))*100
train_missing = train_missing.drop(train_missing[train_missing==0].index).sort_values(ascending=False)


miss_data = pd.DataFrame({'缺失百分比':train_missing})
miss_data
数据分布
1.小区
# len(train_df.loc[:,'Neighborhood'].unique())        # 5547个小区,多类别特征,考虑mean-encoding或target-encoding
# len(test_df.loc[:,'Neighborhood'].unique())        # 3804个小区,多类别特征,考虑mean-encoding或target-encoding
train_nei=set(train_df.loc[:,'Neighborhood'].unique())
test_nei=set(test_df.loc[:,'Neighborhood'].unique())
train_unique=train_nei-(train_nei&test_nei)
test_unique=test_nei-(train_nei&test_nei)

print('训练集独有小区数:{}'.format(len(train_unique)))
print('测试集独有小区:{}'.format(len(test_unique)))

plt.clf()
fig,axs=plt.subplots(1,2,figsize=(13,4))
axs[0].hist(train_df.dropna().loc[:,'Neighborhood'],bins=100,edgecolor='black',alpha=0.5)
axs[1].hist(test_df.dropna().loc[:,'Neighborhood'],bins=100,edgecolor='black',alpha=0.5)
plt.show()
print(train_df.loc[:,'Height'].value_counts())
plt.clf()
fig,axs=plt.subplots(1,2)
axs[0].pie(train_df.loc[:,'Height'].value_counts().values,
        labels=train_df.loc[:,'Height'].value_counts().index,
        autopct='%1.1f%%')
axs[1].pie(test_df.loc[:,'Height'].value_counts().values,
        labels=test_df.loc[:,'Height'].value_counts().index,
        autopct='%1.1f%%')
plt.show()
3.朝向
# print(len(train_df.loc[:,'RoomDir'].value_counts()))        # 64种不同字符串
# print(len(test_df.loc[:,'RoomDir'].value_counts()))        # 54种不同字符串
train_nei=set(train_df.loc[:,'RoomDir'].unique())
test_nei=set(test_df.loc[:,'RoomDir'].unique())
train_unique=train_nei-(train_nei&test_nei)
test_unique=test_nei-(train_nei&test_nei)

print('训练集独有朝向:{}'.format(train_unique))
print('测试集独有朝向:{}'.format(test_unique))


plt.clf()
fig,axs=plt.subplots(2,1,figsize=(15,6),sharex=True)
axs[0].bar(x=train_df.loc[:,'RoomDir'].value_counts().index,height=train_df.loc[:,'RoomDir'].value_counts().values)
axs[1].bar(x=test_df.loc[:,'RoomDir'].value_counts().index,height=test_df.loc[:,'RoomDir'].value_counts().values)
plt.xticks(rotation='90')
plt.show()
统计描述
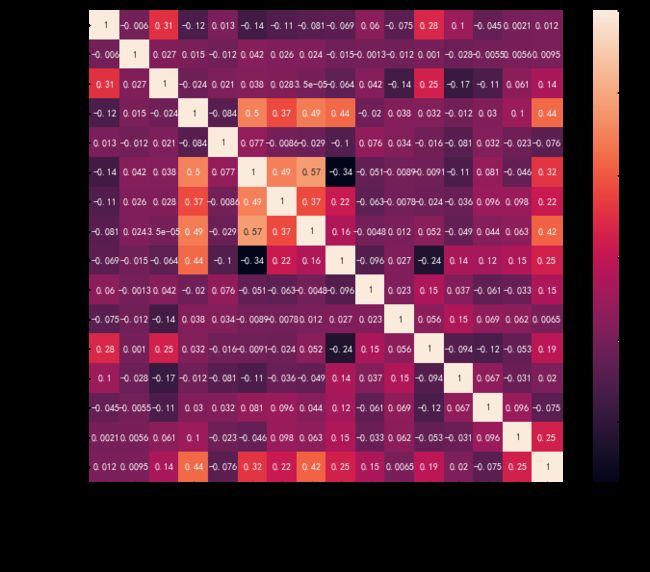
相关性分析
corrmat = df_train.corr()
f, ax = plt.subplots(figsize=(12, 9))
sns.heatmap(corrmat, vmax=.8, square=True,annot=True);
统计量分析
均值,方差,偏态,峰度
例:卧室数量
print(train_df.loc[:,['Bedroom','Rental']].groupby(['Bedroom']).agg(['mean','std']).sort_values(by=('Rental','mean'),ascending=False))

plt.clf()
sns.boxplot(x='Bedroom',y='Rental',data=train_df)
plt.show()
异常值处理
该数据集房屋面积特征有明显异常值
sns.regplot(x=train['房屋面积'],y=y_train['月租金'])
train=train.drop(train[train['房屋面积']>0.15].index)
sns.regplot(x=train['房屋面积'],y=train['月租金'])
plt.show()

训练集里的噪声,这种绝大部分特征相同但目标值不相同对的样本,要么丢弃,要么取一个均值或3月份的值作为预测值。

法一:散点图直观判断删除
法二:如已知数据分布,利用F检验,t检验等检验异常值
法三:利用箱线图的四分位数判断异常值,鲁棒性比较好。
重复数据处理
“首先是一部分特征存在等级划分,如’Region’>‘BusLoc’>‘Neighborhood’,这是地理上的等级;然后是’TolHeight’>‘Height’>‘RoomDir’,这是每套房屋的等级;最后是房屋内部的等级,‘Bedroom’>‘Livingroom’>‘Bathroom’>‘RoomArea’。当然这个等级的次序不同的人有不同的理解,以上次序只是我个人的理解。划分出这些等级的目的其实就是想精准定位出’房屋ID’这个属性,然后就可以找出测试集跟训练集是否有重复数据,对于同一个出租屋,直接用它的历史租金来填充它4月份的租金即可,那么这部分数据就不需要使用模型来预测了。”–Trigger
train_data=pd.read_csv('data/train.csv').fillna(-999)
test_data=pd.read_csv('data/test.csv').fillna(-999)

# 为了便与合并,将除目标值的所有列字符串化
def objectal(df):
    for col in df.columns:
        if col!='Rental':
            df[col]   = df[col].astype(str)
    return df
train_data=objectal(train_data)
test_data=objectal(test_data)

mon1_train_df=train_data[train_data.loc[:,'Time']=='1'].drop(['Time','RentRoom'],axis=1).drop_duplicates()
mon2_train_df=train_data[train_data.loc[:,'Time']=='2'].drop(['Time','RentRoom'],axis=1).drop_duplicates()
mon3_train_df=train_data[train_data.loc[:,'Time']=='3'].drop(['Time','RentRoom'],axis=1).drop_duplicates()

common_cols=list(mon1_train_df.columns)
common_cols.remove('Rental')


# 按月计算出房屋的均租金
mon1_train_df=mon1_train_df.groupby(common_cols,as_index=False).mean()
mon2_train_df=mon2_train_df.groupby(common_cols,as_index=False).mean()
mon3_train_df=mon3_train_df.groupby(common_cols,as_index=False).mean()


# 二月并一月,缺失值由一月数据来填充
recent_mean_rental=mon2_train_df.merge(mon1_train_df,how='outer',on=common_cols).fillna(method='bfill',axis=1)
recent_mean_rental=recent_mean_rental.drop(['Rental_y'],axis=1).rename(columns={'Rental_x':'Rental'})
# 三月并二月,缺失值由二月(一月)来填充
recent_mean_rental=mon3_train_df.merge(recent_mean_rental,how='outer',on=common_cols).fillna(method='bfill',axis=1)
recent_mean_rental=recent_mean_rental.drop(['Rental_y'],axis=1).rename(columns={'Rental_x':'Rental'})

statistic_pred=test_data.merge(recent_mean_rental,how='left',on=common_cols)
statistic_pred.loc[:,['id','Rental']].to_csv('./result/statistic_pred.csv',index=False)
缺失值处理
缺失值的处理方式有:
- 删除带有缺失值的特征,最简单也最浪费信息的方式
- 用均值,众数或固定的数等填充,比1好,但仍不够好
- 考虑缺失的含义,把缺失值作为一种信息
- 用未缺失的数据训练模型,预测缺失的数据(分类型变量用分类算法,数值型变量用回归)
(小tip:把训练集和测试集合并处理,减少代码量)
ntrain = train1.shape[0]
ntest = test.shape[0]

all_data = pd.concat((train1,test)).reset_index(drop=True)
1.地铁站点,距离,地铁线路的缺失值作为一种特征,表示该房屋附近没有地铁
all_data['地铁线路']=all_data['地铁线路'].fillna(0)
all_data['地铁站点']=all_data['地铁站点'].fillna(0)

all_data['距离']=all_data['距离'].fillna(-1)
2.居住状态,装修方式和出租方式为分类变量,其缺失值也作为一种特征
all_data['居住状态']=all_data['居住状态'].fillna(0)
all_data['出租方式']=all_data['出租方式'].fillna(2)
all_data['装修情况']=all_data['装修情况'].fillna(0)
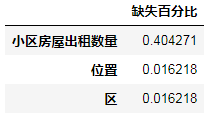
all_data_missing = (all_data.isnull().sum()/len(all_data))*100
all_data_missing = all_data_missing.drop(all_data_missing[all_data_missing==0].index).sort_values(ascending=False)


miss_data1 = pd.DataFrame({'缺失百分比':all_data_missing})
miss_data1
xiaoqu=[]

for i in range(all_data.shape[0]):
    if (np.isnan(all_data.loc[i]['小区房屋出租数量'])&(all_data[all_data['小区名']==all_data.loc[i]['小区名']].shape[0]!=1)):
        xiaoqu.append(all_data[all_data['小区名']==all_data.loc[i]['小区名']]['小区房屋出租数量'].mode()[0])
    else:
        xiaoqu.append(all_data.loc[i]['小区房屋出租数量'])
 #待精简

all_data_missing = (all_data.isnull().sum()/len(all_data))*100
all_data_missing = all_data_missing.drop(all_data_missing[all_data_missing==0].index).sort_values(ascending=False)


miss_data1 = pd.DataFrame({'缺失百分比':all_data_missing})
miss_data1
train[np.isnan(train['位置'])]
#小区名为3269的均没有位置和所在区,后面分开处理
数据变换
all_data['东'] = all_data.房屋朝向.map(lambda x : 1 if '东' in x else 0)
all_data['西'] = all_data.房屋朝向.map(lambda x : 1 if '西' in x else 0)
all_data['南'] = all_data.房屋朝向.map(lambda x : 1 if '南' in x else 0)
all_data['北'] = all_data.房屋朝向.map(lambda x : 1 if '北' in x else 0)

all_data['东南'] = all_data.房屋朝向.map(lambda x : 1 if '东南' in x else 0)
all_data['西南'] = all_data.房屋朝向.map(lambda x : 1 if '西南' in x else 0)
all_data['东北'] = all_data.房屋朝向.map(lambda x : 1 if '东北' in x else 0)
all_data['西北'] = all_data.房屋朝向.map(lambda x : 1 if '西北' in x else 0)

all_data.drop('房屋朝向',axis=1,inplace = True)
我用的catboost模型,该模型相比xgboost和lgb运行速度要快很多,能够处理类别型变量,无需对类别型变量做one-hot编码
for i in ['位置', '出租方式','地铁站点', '地铁线路', '居住状态','装修情况']:
    all_data[i]=pd.Categorical(all_data[i])
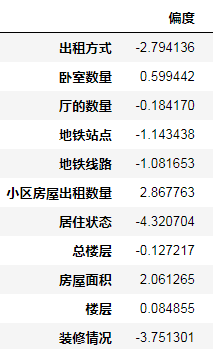
对数值型变量,做对数变换减小其峰度及偏度 (单调数据变换对树模型无效)
for i in ['卧室数量', '卫的数量', '厅的数量','小区房屋出租数量', '总楼层', '房屋面积', '楼层']:
    all_data[i]=all_data[i].map(lambda x:np.log1p(x))

rank=pd.DataFrame(all_data.skew(),columns=['偏度'])

rank['峰度']=all_data.kurt().values
rank
x_train = all_data[:ntrain]
x_test = all_data[ntrain:]
将位置和区为空的数据分离开来,做两部分处理
x_train_1=x_train[np.isnan(x_train['区'])]

x_train_2=x_train.drop(index=x_train_1.index)

x_train_1.drop(['区','位置'],axis=1,inplace=True)

y_train_1=y_train.loc[x_train_1.index]

y_train_2=y_train.drop(index=x_train_1.index)

test_1=x_test[np.isnan(x_test['区'])]

test_2=x_test.drop(index=test_2.index)

test_1.drop(['位置','区'],inplace=True,axis=1)
特征工程(重点!)
这也算是参加比赛的初衷吧,虽然构建的特征效果并不是很好,但是锻炼思路也是好的。一开始的时候憋死出不来一个,在网上查查买房的各种技巧和指标之类的,自己就构建出来了很多特征。
baseline(xgboost模型)
以默认参数的XGB分数为准,低于此基准线2.554的模型一律不考虑。
train_df=pd.read_csv('data/train.csv')
test_df=pd.read_csv('data/test.csv')
train_df.loc[:,'RoomDir']=LabelEncoder().fit_transform(train_df.loc[:,'RoomDir'])
test_df.loc[:,'RoomDir']=LabelEncoder().fit_transform(test_df.loc[:,'RoomDir'])

X_train=train_df.drop(['Rental'],axis=1)
Y_train=train_df.loc[:,'Rental']
X_test=test_df.drop(['id'],axis=1)
test_id=test_df.loc[:,'id']

xgb_reg=XGBRegressor(max_depth=5,n_estimators=500,n_jobs=-1)
xgb_reg.fit(X_train,Y_train)
Y_pred=xgb_reg.predict(X_test)

sub=pd.DataFrame({
    'id':test_id,
    'price':Y_pred
})
sub.to_csv('baseline.csv',index=False)    #baseline:2.554
def xgb_eval(train_df,val_df):
    train_df=train_df.copy()
    val_df=val_df.copy()

    try:
        from sklearn.preprocessing import LabelEncoder
        lb_encoder=LabelEncoder()
        lb_encoder.fit(train_df.loc[:,'RoomDir'].append(val_df.loc[:,'RoomDir']))
        train_df.loc[:,'RoomDir']=lb_encoder.transform(train_df.loc[:,'RoomDir'])
        val_df.loc[:,'RoomDir']=lb_encoder.transform(val_df.loc[:,'RoomDir'])
    except Exception as e:
        print(e)

    import xgboost as xgb
    X_train=train_df.drop(['Rental'],axis=1)
    Y_train=train_df.loc[:,'Rental'].values
    X_val=val_df.drop(['Rental'],axis=1)
    Y_val=val_df.loc[:,'Rental'].values

    from sklearn.metrics import mean_squared_error

    try:
        eval_df=val_df.copy().drop('Time',axis=1)
    except Exception as e:
        eval_df=val_df.copy()

    reg_model=xgb.XGBRegressor(max_depth=5,n_estimators=500,n_jobs=-1)
    reg_model.fit(X_train,Y_train)

    y_pred=reg_model.predict(X_val)
    print(np.sqrt(mean_squared_error(Y_val,y_pred)),end=' ')

    eval_df.loc[:,'Y_pred']=y_pred
    eval_df.loc[:,'RE']=eval_df.loc[:,'Y_pred']-eval_df.loc[:,'Rental']

    print('')
    feature=X_train.columns
    fe_im=reg_model.feature_importances_
    print(pd.DataFrame({'fe':feature,'im':fe_im}).sort_values(by='im',ascending=False))

    import matplotlib.pyplot as plt
    plt.clf()
    plt.figure(figsize=(15,4))
    plt.plot([Y_train.min(),Y_train.max()],[0,0],color='red')
    plt.scatter(x=eval_df.loc[:,'Rental'],y=eval_df.loc[:,'RE'])
    plt.show()

    return eval_df
原始特征丢弃尝试
以XGB做原生特征筛选,在原生特征中丢弃后不影响分数甚至涨分的特征有:Time,房屋出租数(涨幅明显),房屋朝向,卧室数量,出租类型(涨幅明显),地铁线路(涨幅明显),距离(涨幅明显)
# 丢弃各特征后的分数
# ‘Time':2.558,'Neighborhood':2.592,'RentRoom':2.531,'Height':2.57,'TolHeight':2.591,'RoomArea':3
# 'RoomDir':2.548,'RentStatus':2.561,'Bedroom':2.584,'Livingroom':2.548,'Bathroom':2.590,'RentType':2.538
# 'Region':2.583,'BusLoc':2.594,'SubwayLine':2.521,'SubwaySta':2.569,'SubwayDis':2.537,'RemodCond':2.571
for col in train_df.columns:
    if col!='Rental':
        print('drop col:{}'.format(col))
        tmp_train_df=train_df.drop([col],axis=1)
        tmp_val_df=val_df.drop([col],axis=1)
        eval_df=xgb_eval(train_df=tmp_train_df,val_df=tmp_val_df)
# 地铁特征,房子是否有'近地铁'这个属性:重要性为0
tmp_train_df=train_df.copy()
tmp_val_df=val_df.copy()
tmp_train_df.loc[:,'NearSubway']=(~tmp_train_df.loc[:,'SubwayLine'].isnull()).astype(np.int8).values ## 重点
tmp_val_df.loc[:,'NearSubway']=(~tmp_val_df.loc[:,'SubwayLine'].isnull()).astype(np.int8).values

eval_df=xgb_eval(train_df=tmp_train_df,val_df=tmp_val_df)
根据有序特征进行聚类,构造无监督特征
# eps=0.1,不编码原聚类特征
# 得分:2.544
cls_cols=['Height','TolHeight','RoomArea','Bedroom','Livingroom','Bathroom']        # 聚类列
all_cols=cls_cols+['Rental']

tmp_train_df=train_df.copy()
tmp_val_df=val_df.copy()
need_scale=tmp_train_df.loc[:,cls_cols].append(tmp_val_df.loc[:,cls_cols])

from sklearn.preprocessing import MinMaxScaler
mm_scaler=MinMaxScaler()
need_scale=mm_scaler.fit_transform(need_scale)

from sklearn.cluster import DBSCAN
cls_model=DBSCAN(eps=0.1, min_samples=3,n_jobs=-1).fit(need_scale)

tmp_train_df.loc[:,'clsFe']=cls_model.labels_[:len(tmp_train_df)]
tmp_val_df.loc[:,'clsFe']=cls_model.labels_[len(tmp_train_df):]

eval_df=xgb_eval(train_df=tmp_train_df,val_df=tmp_val_df)
rank-encoding/mean-encoding
使用循环对所有列遍历做编码。两种编码方式类似,只是一个是离散特征,一个是连续特征,后者容易过拟合。
# 朝向rank-encoding:2.550
rank_df=tmp_train_df.loc[:,['RoomDir','Rental']].groupby('RoomDir',as_index=False).mean().sort_values(by='Rental').reset_index(drop=True)
rank_df.loc[:,'RoomDir'+'_rank']=rank_df.index+1
rank_fe_df=rank_df.drop(['Rental'],axis=1)
tmp_train_df=tmp_train_df.merge(rank_fe_df,how='left',on='RoomDir') ###划重点!!!!
tmp_val_df=tmp_val_df.merge(rank_fe_df,how='left',on='RoomDir')
tmp_train_df.drop(['RoomDir'],axis=1,inplace=True)
tmp_val_df.drop(['RoomDir'],axis=1,inplace=True)

eval_df=xgb_eval(train_df=tmp_train_df,val_df=tmp_val_df)

# 以平均租金为准添加评级特征,部分有用
# 'Time':2.554,'Height':2.549,'TolHeight'2.545
# 'Bedroom':2.546,'Livingroom':2.550,'Bathroom':2.551,'RentType':2.554
# 'Region':2.491,'BusLoc':2.480,'SubwayLine':2.539,'SubwaySta':'2.518','RemodCond':2.543
rank_cols=['Time','Height','TolHeight','Bedroom','Livingroom','Bathroom',
           'RentType','Region','BusLoc','SubwayLine','SubwaySta','RemodCond']
for col in rank_cols:
    if col!='Rental':
        print(col+'_rank_encoding...')
        tmp_train_df=train_df.copy()
        tmp_val_df=val_df.copy()

        rank_df=train_df.loc[:,[col,'Rental']].groupby(col,as_index=False).mean().sort_values(by='Rental').reset_index(drop=True)
        rank_df.loc[:,col+'_rank']=rank_df.index+1        # +1,为缺失值预留一个0值的rank
        rank_fe_df=rank_df.drop(['Rental'],axis=1)
        tmp_train_df=tmp_train_df.merge(rank_fe_df,how='left',on=col)
        tmp_val_df=tmp_val_df.merge(rank_fe_df,how='left',on=col)
        tmp_train_df.drop([col],axis=1,inplace=True)
        tmp_val_df.drop([col],axis=1,inplace=True)

        eval_df=xgb_eval(train_df=tmp_train_df,val_df=tmp_val_df)
依据领域知识构建特征:
这是重要且主要的手段,考虑到大多数人不喜欢住在最高层或者最底层,所以构建了房子所在层数/总层数这一指标.还有卧室面积,厅的面积等等
x_train_2['卧室面积']=x_train_2.房屋面积/x_train_2['卧室数量']
x_train_2['楼层比']=x_train_2.楼层/x_train_2.总楼层
test_2['卧室面积']=test_2.房屋面积/test_2['卧室数量']
test_2['楼层比']=test_2.楼层/test_2.总楼层
x_train_2['卧室面积']=x_train_2.卧室面积*100
test_2['卧室面积']=test_2.卧室面积*100
再考虑到房子的朝向,南北朝向的房子通风性比东西朝向的好,所以在原有基础上构建南_北,东_西两个特征。再有小区房屋出租率,总房间数,房型(几室几厅)
特征选择
一股脑加上所有特征表现不佳,使用贪心策略(前向选择、后向选择)逐个添加特征。前面自己构造了一堆特征,然后就一股脑加上去了,掉分太厉害。
# 前向特征选择这块用for循环暴力搜出来的最优特征组合,最终筛选出来的特征组合为:
# ['ab_Height','TolRooms','Area/Room','BusLoc_rank','SubwayLine_rank']

comb_train_df.loc[:,'ab_Height']=comb_train_df.loc[:,'Height']/(comb_train_df.loc[:,'TolHeight']+1)
comb_val_df.loc[:,'ab_Height']=comb_val_df.loc[:,'Height']/(comb_val_df.loc[:,'TolHeight']+1)

comb_train_df.loc[:,'TolRooms']=comb_train_df.loc[:,'Livingroom']+comb_train_df.loc[:,'Bedroom']+comb_train_df.loc[:,'Bathroom']
comb_val_df.loc[:,'TolRooms']=comb_val_df.loc[:,'Livingroom']+comb_val_df.loc[:,'Bedroom']+comb_val_df.loc[:,'Bathroom']
comb_train_df.loc[:,'Area/Room']=comb_train_df.loc[:,'RoomArea']/(comb_train_df.loc[:,'TolRooms']+1)
comb_val_df.loc[:,'Area/Room']=comb_val_df.loc[:,'RoomArea']/(comb_val_df.loc[:,'TolRooms']+1)

rank_cols=['BusLoc','SubwayLine']
for col in rank_cols:
    rank_df=train_df.loc[:,[col,'Rental']].groupby(col,as_index=False).mean().sort_values(by='Rental').reset_index(drop=True)
    rank_df.loc[:,col+'_rank']=rank_df.index+1        # +1,为缺失值预留一个0值的rank
    rank_fe_df=rank_df.drop(['Rental'],axis=1)
    comb_train_df=comb_train_df.merge(rank_fe_df,how='left',on=col)
    comb_val_df=comb_val_df.merge(rank_fe_df,how='left',on=col)
    try:
        comb_train_df.drop([col],axis=1,inplace=True)
        comb_val_df.drop([col],axis=1,inplace=True)
    except Exception as e:
        print(e)
for drop_col in drop_cols:
        try:
            comb_train_df.drop(drop_col,axis=1,inplace=True)
            comb_val_df.drop(drop_col,axis=1,inplace=True)
        except Exception as e:
            pass

# 贪心策略添加特征,目前为:2.403
eval_df=xgb_eval(train_df=comb_train_df,val_df=comb_val_df)
catboost模型
cat = CatBoostRegressor(iterations=10000,
                              learning_rate=0.1,
                              depth=6,
                              l2_leaf_reg=3,
                              border_count=185,
                              loss_function='RMSE',
                              verbose=200)
def rmse_cv(model):
    rmse = np.sqrt(-cross_val_score(model,x_train_2 , y_train_2,
                                    scoring="neg_mean_squared_error", cv = 3))
    return rmse
调参
- 对于不是很大的数据集可以用sklearn的Gridcvsearch来暴力调参。
示例代码:
params = {'depth':[3],
          'iterations':[5000],
          'learning_rate':[0.1,0.2,0.3],
          'l2_leaf_reg':[3,1,5,10,100],
          'border_count':[32,5,10,20,50,100,200]}
clf = GridSearchCV(cat, params, cv=3)
clf.fit(x_train_2, y_train_2)
对于较大的数据集,用第一种方法耗时特别长,本题数据我取了数据集的60%,两个队友一人一半都跑了三天(无奈),比较浪费时间。
2. 逐个参数调,先取定其它参数,遍历第一个参数,选择最优值,再调下一个参数。省时但有的时候容易陷入局部最优。
3. 观察数据的分布来调整对应的参数,如树模型的叶子节点数,变量较多,叶子数少欠拟合。
模型融合(重要上分手段)
1.基本融合:根据各模型的线上分,按比例调整预测结果
2.stacking:原理就不赘述了,网上比较多。sklearn里的stacking可以实现。
总结:数据单调变换对树模型效果并不显著,比赛的时候在这一直调整数据的偏态峰度,浪费了很多时间。构造特征后一块加入,没有做特征选择,导致分数一直上不去。调参,数据集很大,暴力搜索花费时间特别长,效率很低。对数据的洞察很重要,特别是噪声和重复值,对模型的得分影响很大。ok,玩的差不多了,该收收心了~
附特征工程好文:https://machinelearningmastery.com/discover-feature-engineering-how-to-engineer-features-and-how-to-get-good-at-it/


