3D轨迹图的绘制及其gif保存
绘制三维轨迹图
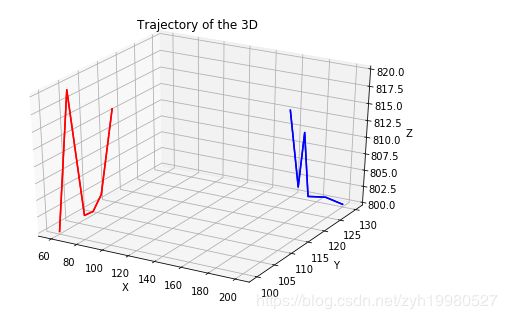
单纯的画3D轨迹图相对来说比较简单,也有很多种方法,这里主要用Axes3D去画
- 首先导入要用的模块
from typing import List
import matplotlib.pyplot as plt
import mpl_toolkits.mplot3d.axes3d as p3
- 建立画布
fig = plt.figure()
ax = p3.Axes3D(fig)
- 导入数据,这里可以根据自己的需要去改,我这里是自己随便写了几个list,也可以自己从csv或者其他地方读取数据,改一下就可以了
high: List[float] = [800,820,801,801,803,815]
longitude: List[float] = [100,103,105,107,109,112]
latitude: List[float] = [60,62,65,66,67,69]
z: List[float] = [800,801,801,811,803,815]
x: List[float] = [200,189,178,176,175,172]
y: List[float] = [130,129,128,127,126,124]
- 轨迹线绘制
ax.plot(latitude, longitude, high, color='red')
line_1 = ax.plot(latitude, longitude, high, color='red')
ax.plot(x, y, z, color='blue')
line_2 = ax.plot(x, y, z, color='blue')
lines = [line_1[0], line_2[0]]
- 坐标轴设置及最终效果显示
ax.set_xlabel('X')
ax.set_ylabel('Y')
ax.set_zlabel('Z')
ax.set_title('Trajectory of the 3D')
plt.show()
最后放上全部的代码大家复制粘贴安装包就可以直接跑了
# -*- coding: utf-8 -*-
"""
Created on Sun Apr 26 12:49:00 2020

@author: yunhui
"""
from typing import List
import matplotlib.pyplot as plt
import mpl_toolkits.mplot3d.axes3d as p3


fig = plt.figure()
ax = p3.Axes3D(fig)
 # 绘制出两条轨迹线
high: List[float] = [800,820,801,801,803,815]
longitude: List[float] = [100,103,105,107,109,112]
latitude: List[float] = [60,62,65,66,67,69]

z: List[float] = [800,801,801,811,803,815]
x: List[float] = [200,189,178,176,175,172]
y: List[float] = [130,129,128,127,126,124]

ax.plot(latitude, longitude, high, color='red')
line_1 = ax.plot(latitude, longitude, high, color='red')
ax.plot(x, y, z, color='blue')
line_2 = ax.plot(x, y, z, color='blue')
lines = [line_1[0], line_2[0]]

ax.set_xlabel('X')

ax.set_ylabel('Y')

ax.set_zlabel('Z')

ax.set_title('Trajectory of the 3D')
plt.show()
3D轨迹图绘制gif图片保存
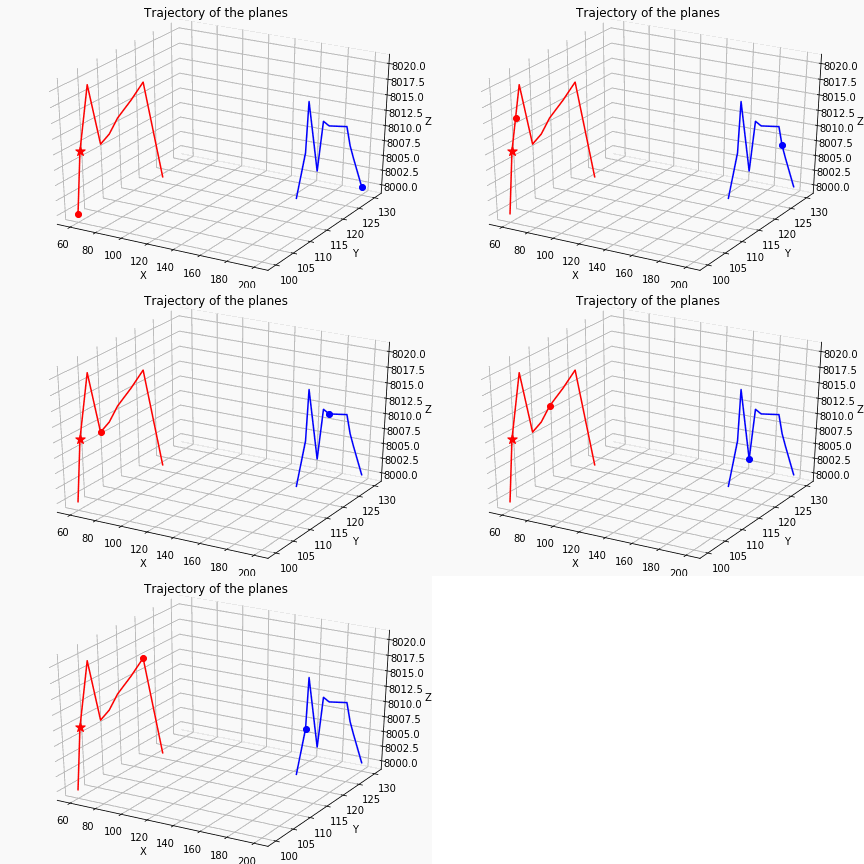
主要就是多了一个gif的渲染,可以通过调节渲染的帧率等来控制轨迹移动的快慢等,直接给大家放代码和效果图
# -*- coding: utf-8 -*-
"""
Created on Sun May 10 18:10:41 2020

@author: yunhui
"""

from typing import List
import matplotlib.pyplot as plt
import mpl_toolkits.mplot3d.axes3d as p3
import matplotlib.animation as animation


def update_lines(num, dataLines, lines):
    for line, data in zip(lines, dataLines):
        line.set_data(data[0][num], data[1][num])
        line.set_3d_properties(data[2][num])
    return lines

fig = plt.figure()
ax = p3.Axes3D(fig)
 # 绘制出两条轨迹线
high: List[float] =      [8000,8010,8015,8020,8010,8011,8013,8015,8017,8000]
longitude: List[float] = [100, 101, 102, 103, 105, 107, 109, 112, 115, 119]
latitude: List[float] =  [60,  61,  62,  63,  65,  66,  67,  69,  70,  72]
ax.plot(latitude, longitude, high, color='red')
line_1 = ax.plot(latitude, longitude, high,marker='o', color='red')
z: List[float] =         [8000,8005,8007,8010,8010,8011,8003,8015,8007,8000]
y: List[float] =         [130, 129, 129, 129, 128, 127, 126, 124, 123, 121]
x: List[float] =         [200, 195, 192, 189, 178, 176, 175, 172, 173, 172]
ax.plot(x, y, z, color='blue')
line_2 = ax.plot(x, y, z,marker='o', color='blue')
lines = [line_1[0], line_2[0]]

ax.set_xlabel('X')
ax.set_ylabel('Y')
ax.set_zlabel('Z')
ax.set_title('Trajectory of the planes')

length_data = len(latitude)
 # 选择 5 个关键节点
select_index = range(0, length_data, length_data // 5)
select_la: List[float] = [latitude[i] for i in select_index]
select_lo: List[float] = [longitude[i] for i in select_index]
select_al: List[float] = [high[i] for i in select_index]
select_x: List[float] = [x[i] for i in select_index]
select_y : List[float] = [y[i] for i in select_index]
select_z: List[float] = [z[i] for i in select_index]
total_data = [[select_la, select_lo, select_al], [select_x, select_y, select_z]]
len_select: int = len(select_x)
# Creating the Animation object
line_ani = animation.FuncAnimation(fig, update_lines, len_select, fargs=(total_data, lines),
                                           interval = 1, blit=False)
#把一些特俗的点标出来
ax.scatter(latitude[1], longitude[1], high[1], s=100,c='r',marker='*')

plt.show()
line_ani.save('plot.gif', writer='pillow',fps=2)

