【机器学习算法笔记系列】K-近邻(KNN)算法详解和实战
KNN算法
算法概述
K最近邻(K-Nearest Neighbor, KNN)算法,是著名的模式识别统计学方法,在机器学习分类算法中占有相当大的地位。它是一个理论上比较成熟的方法。既是最简单的机器学习算法之一,也是基于实例的学习方法中最基本的,又是最好的文本分类算法之一。
算法原理:“近朱者赤近墨者黑”
KNN的输入是测试数据和训练样本数据集,输出是测试样本的类别。KNN没有显示的训练过程,在测试时,计算测试样本和所有训练样本的距离,根据最近的K个训练样本的类别,通过多数投票的方式进行预测。算法描述如下:

K近邻使用的模型实际上对应于对特征空间的划分。模型由三个基本要素:距离度量、K值的选择和分类决策规则决定。

计算步骤:
- 算距离:给定测试对象,计算它与训练集中的每一个对象的距离。
- 找邻居:圈定距离最近的K个训练样本,作为测试样本的"近邻"。如何选择“K”值是KNN算法的核心。
- 做分类:根据这K个近邻归属的主要类别(多数表决规则:K个近邻的训练样本中的多数类,决定了测试样本的类别)来对测试对象进行分类。
算法优缺点
优点
- 算法思想简单,易于理解,易于实现,无需估计参数,无需训练
- 对异常值和噪声有较高的容忍度
- 适合对稀有事件进行分类
- 适合于多分类问题(多模态,对象具有多个类别标签)
缺点
- 懒惰算法,对测试样本进行分类时计算量大,要计算每一个待分类样本到全部训练样本的距离,内存开销大
- 模型可解释性差,无法通过模型了解各个变量的重要性,无法给出像决策树那样的规则
- 当样本不平衡时,如其中一个类别的样本较大,可能会导致对新样本计算近邻时,大容量样本占大多数,影响分类效果
Python实践
scikit-learn中提供了一个KNeighborsClassifier类来实现k近邻分类模型。KNeighborsClassifier
其原型为:sklearn.neighbors.KNeighborsClassifier(n_neighbors=5, weights=’uniform’, algorithm=’auto’, leaf_size=30, p=2, metric=’minkowski’, metric_params=None, n_jobs=None, **kwargs)
参数:
n_neighbors: int,指定k值,默认值为5。
weights: str或callable,指定投票权重类型,默认为uniform。 [callable]: 一个用户定义的函数,它接受一个距离数组,并返回一个包含权重的相同形状的数组。
"uniform": 所有邻居的投票权重都相等。"distance": 所有邻居节点的投票权重与距离成反比。即越近的节点,其投票权重越大。
algorithm: str,指定计算最近邻的算法,默认为auto。
ball_tree: 使用BallTree算法kd_tree: 使用KDTree算法brute: 使用暴力搜索法auto: 自动决定最合适的算法
leaf_size:int,指定BallTree或者KDTree叶节点的规模。它影响树的构建和查询速度。
metric:str,指定距离度量。默认为minkowski距离。
p:int,指定在minkowski度量上的指数。如果p=1,对应曼哈顿距离;如果p=2,对应欧拉距离。
n_jobs:并行性。默认为-1,表示派发任务到所有计算机的CPU上。
方法
fit(X, y): 训练模型。
predict(X, y): 使用模型来预测,返回待预测样本的标签。
score(X, y): 返回在(X, y)上预测的准确率(accuracy)。
predict_proba(X): 返回样本为每种标签下的概率。
kneighbors([X, n_neighbors, return_distance]): 返回样本点的k近邻点。如果return_distance=True,同时还返回到这些近邻点的距离
kneighbors_graph([X, n_neighbors, model]):返回样本点的连接图
KNN实战—糖尿病预测
本文使用K-近邻算法,对Pima印第安人的糖尿病进行预测,数据来源于Kaggle,糖尿病数据地址。

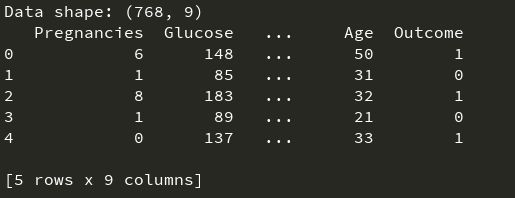
首先,使用Pandas加载数据,输出数据形状和前5行,以查看数据:
__author__ = "fpZRobert"

"""
    KNN实战:糖尿病预测
"""
import numpy as np
import pandas as pd

"""
    加载数据
"""
data = pd.read_csv("./data/diabetes.csv")
print("Data shape: {}".format(data.shape))
print(data.head(5))   # 查看数据前5列

从输出可以看出,总共768个样本,8个特征,其中Outcome为类别,0表示没有糖尿病,1表示有糖尿病,这8个特征分别如下:
| 特征 | 含义 |
|---|---|
| Pregnancies | 怀孕的次数 |
| Glucose | 血浆葡萄糖浓度,采用2小时口服葡萄糖耐量试验测得 |
| BloodPressure | 舒张压(毫米汞柱) |
| SkinThickness | 肱三头肌皮肤褶皱厚度(毫米) |
| Insulin | 两个小时血清胰岛素(μU/毫升) |
| BMI | 身体质量指数, 体重除以身高的平方可得 |
| Diabetes Pedigree Function | 糖尿病血统指数,糖尿病和家庭遗传相关 |
| Age | 年龄 |
我们可以进一步观察数据集中阳性和阴性样本的个数:
print(data.groupby("Outcome").size())

out:
Outcome
0	500
1	268
dtype: int64
其中阴性样本为500例,阳性样本268例。接着,需要对数据集进行简单的处理,把8个特征值分离出来,作为训练数据集,把Outcome列分离出来作为目标值。然后,把数据集划分为训练集和测试集(划分比例一般80%用于训练,20%用于测试)。
"""
    构造训练集和测试集
"""
X = data.iloc[:, 0:8]
y = data.iloc[:, 8]
print("Shape of X: {}, Shape of Y: {}".format(X.shape, y.shape))

from sklearn.model_selection import train_test_split
X_train, X_test, y_train, y_test = train_test_split(X, y, test_size=0.2)
使用KNN算法对数据集进行拟合,并计算评分:
from sklearn.neighbors import KNeighborsClassifier
"""
    训练模型
"""
knn_clf = KNeighborsClassifier(n_neighbors=2)
knn_clf.fit(X_train, y_train)
train_score = knn_clf.score(X_train, y_train)
test_score = knn_clf.score(X_test, y_test)
print("train score=", train_score, "test score=", test_score)

Out:
train score= 0.8355048859934854 test score= 0.6883116883116883
由于训练样本和测试样本是随机分配的,不同的训练样本和测试样本的组合可能导致最后计算出来的算法准确性存在差异,那么如何更加准确的计算算法的准确性呢?一个办法是,多次随机分配训练集和验证集,然后求模型准确性评分的平均值。我们可以利用scikit-learn提供的KFold和cross_val_score()函数来解决此问题:
"""
    k折交叉验证计算模型准确性
"""
from sklearn.model_selection import KFold
from sklearn.model_selection import cross_val_score

kfold = KFold(n_splits=10)  # 将数据集分成十份,进行10折交叉验证: 其中1份作为交叉验证集计算模型准确性,剩余9份作为训练集进行训练
cv_result = cross_val_score(knn_clf, X, y, cv=kfold)
print("cross val score=", cv_result.mean())

Out:
cross val score= 0.7147641831852358
通过KNN算法模型对数据集进行训练,查看对训练样本的拟合情况以及对测试样本的预测准确率情况。我们发现有两个问题:(1)模型对训练样本拟合情况不佳,说明算法模型太简单,无法很好的拟合训练样本。(2)模型的准确率欠佳。我们可以进一步画出学习曲线,以便发现问题和为模型优化提供思路(学习曲线):
import matplotlib.pyplot as plt
from sklearn.model_selection import ShuffleSplit
from sklearn.model_selection import learning_curve

# 绘制学习曲线
def plot_learning_curve(estimator, title, X, y,
			ylim=None, cv=None,n_jobs=None,
			train_sizes=np.linspace(.1, 1.0, 5)):
    plt.figure()
    plt.title(title)
    if ylim is not None:
        plt.ylim(*ylim)
    plt.xlabel("Training examples")
    plt.ylabel("Score")
    train_sizes, train_scores, test_scores = learning_curve(estimator, X, y,
    							cv=cv, n_jobs=n_jobs,
    							train_sizes=train_sizes)
    train_scores_mean = np.mean(train_scores, axis=1)
    train_scores_std = np.std(train_scores, axis=1)
    test_scores_mean = np.mean(test_scores, axis=1)
    test_scores_std = np.std(test_scores, axis=1)
    plt.grid()

    plt.fill_between(train_sizes, train_scores_mean - train_scores_std,
                     train_scores_mean + train_scores_std,
                     alpha=0.1, color="r")
    plt.fill_between(train_sizes, test_scores_mean - test_scores_std,
                     test_scores_mean + test_scores_std,
                     alpha=0.1, color="g")
    plt.plot(train_sizes, train_scores_mean, 'o-', color="r",
    		label="Training score")
    plt.plot(train_sizes, test_scores_mean, 'o-', color="g",
    		label="Cross-validation score")

    plt.legend(loc="best")
    return plt

knn_clf = KNeighborsClassifier(n_neighbors=2)
cv = ShuffleSplit(n_splits=10, test_size=0.2, random_state=0)
plot_learning_curve(knn_clf, "Learning Curve for KNN Diabetes",
                    X, y, (0.0, 1.01), cv=cv)
plt.show()
学习曲线如下图所示:

从图中可以看出,训练样本评分较低,且测试样本与训练样本距离较大,这是典型的欠拟合问题,遗憾的是,KNN算法没有比较好的措施来解决欠拟合问题。后面,读者可以尝试利用其它算法(例如逻辑回归算法,支持向量机算法)来进行糖尿病的预测,后面我也会给出利用逻辑回归和支持向量机算法对糖尿病进行预测,敬请期待。
全部代码如下:
__author__ = "fpZRobert"

"""
    KNN实战:糖尿病预测
"""

import numpy as np
import pandas as pd
import matplotlib.pyplot as plt
from sklearn.model_selection import ShuffleSplit
from sklearn.model_selection import learning_curve
from sklearn.neighbors import KNeighborsClassifier
from sklearn.model_selection import train_test_split
from sklearn.model_selection import KFold
from sklearn.model_selection import cross_val_score

"""
    加载数据
"""
data = pd.read_csv("./data/diabetes.csv")
print("Data shape: {}".format(data.shape))
print(data.head(5))   # 查看数据前5列
print(data.groupby("Outcome").size())

"""
    构造训练集和测试集
"""
X = data.iloc[:, 0:8]
y = data.iloc[:, 8]
print("Shape of X: {}, Shape of y: {}".format(X.shape, y.shape))
X_train, X_test, y_train, y_test = train_test_split(X, y, test_size=0.2)

"""
    训练模型
"""
knn_clf = KNeighborsClassifier(n_neighbors=2)
knn_clf.fit(X_train, y_train)
train_score = knn_clf.score(X_train, y_train)
test_score = knn_clf.score(X_test, y_test)
print("train score=", train_score, "test score=", test_score)

"""
    k折交叉验证计算模型准确性
"""

kfold = KFold(n_splits=10)  # 将数据集分成十份,进行10折交叉验证

cv_result = cross_val_score(knn_clf, X, y, cv=kfold)
print("cross val score=", cv_result.mean())

# 绘制学习曲线
def plot_learning_curve(estimator, title, X, y,
			ylim=None, cv=None,n_jobs=None,
			train_sizes=np.linspace(.1, 1.0, 5)):
    plt.figure()
    plt.title(title)
    if ylim is not None:
        plt.ylim(*ylim)
    plt.xlabel("Training examples")
    plt.ylabel("Score")
    train_sizes, train_scores, test_scores = learning_curve(estimator, X, y,
    							cv=cv, n_jobs=n_jobs,
    							train_sizes=train_sizes)
    train_scores_mean = np.mean(train_scores, axis=1)
    train_scores_std = np.std(train_scores, axis=1)
    test_scores_mean = np.mean(test_scores, axis=1)
    test_scores_std = np.std(test_scores, axis=1)
    plt.grid()

    plt.fill_between(train_sizes, train_scores_mean - train_scores_std,
                     train_scores_mean + train_scores_std,
                     alpha=0.1, color="r")
    plt.fill_between(train_sizes, test_scores_mean - test_scores_std,
                     test_scores_mean + test_scores_std,
                     alpha=0.1, color="g")
    plt.plot(train_sizes, train_scores_mean, 'o-', color="r",
    		label="Training score")
    plt.plot(train_sizes, test_scores_mean, 'o-', color="g",
    		label="Cross-validation score")

    plt.legend(loc="best")
    return plt

knn_clf = KNeighborsClassifier(n_neighbors=2)
cv = ShuffleSplit(n_splits=10, test_size=0.2, random_state=0)
plot_learning_curve(knn_clf, "Learning Curve for KNN Diabetes",
                    X, y, (0.0, 1.01), cv=cv)
plt.show()