R语言做贝叶斯网络结构学习
- 实例分析
- pcalg包的安装
- 贝叶斯网络结构学习
- iris数据集
- Adult数据集
本文使用pcalg包做贝叶斯网络结构的学习
实例分析
pcalg包的安装
安装pcalg包时由于有些依赖包已经被CRAN撤掉,所以安装起来有些技巧。
以下是安装代码:
install.packages("pcalg")
## 如果https://不行可以改成http://试试
source("https://bioconductor.org/biocLite.R")
#如果遇到Update all/some/none? [a/s/n]:  填a就可以了
biocLite("graph")
biocLite("RBGL")
biocLite("Rgraphviz")
贝叶斯网络结构学习
iris数据集
我们使用iris数据集进行学习,这是一个针对连续变量的结构学习的例子:
suffStat <-list(C = cor(iris[,1:4]), n = nrow(iris))
pc.fit <- pc(suffStat, indepTest = gaussCItest,
             alpha = 0.01,labels =names(iris[1:4]),verbose = TRUE)
pc.fit
plot(pc.fit)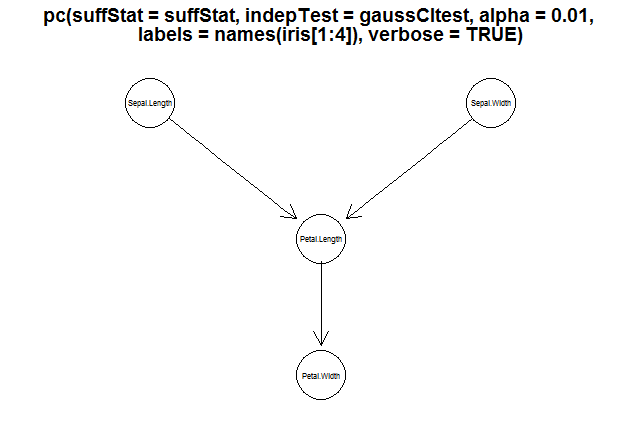
Adult数据集
该数据从美国1994年人口普查数据库抽取而来,可以用来预测居民收入是否超过50K/year。该数据集类变量为年收入是否超过50k$,属性变量包含年龄,工种,学历,职业,人种等重要信息,值得一提的是,14个属性变量中有7个类别型变量。
- age – The age of the individual
- type_employer – The type of employer the individual has. Whether they are government, military, private, an d so on.
- fnlwgt – The # of people the census takers believe that observation - represents. We will be ignoring this variable
- education – The highest level of education achieved for that individual
- education_num – Highest level of education in numerical form
- marital – Marital status of the individual
- occupation – The occupation of the individual
- relationship – A bit more difficult to explain. Contains family relationship values like husband, father, and so on, but only contains one per observation. I’m not sure what this is supposed to represent
- race – descriptions of the individuals race. Black, White, Eskimo, and so on
- sex – Biological Sex
- capital_gain – Capital gains recorded
- capital_loss – Capital Losses recorded
- hr_per_week – Hours worked per week
- country – Country of origin for person
- income – Boolean Variable. Whether or not the person makes more than $50,000 per annum income.
对于离散数据,我们使用 G2 统计量来检验条件独立性。
接来下探索一下,教育,婚姻状态,职业,收入的关系是怎样的:
url <- "http://archive.ics.uci.edu/ml/machine-learning-databases/adult/adult.data"
adult <- read.csv(url, strip.white = TRUE, header = FALSE,
    col.names=c("age", "type_employer", "fnlwgt", "education",
    "education_num","marital", "occupation", "relationship", "race","sex",
    "capital_gain", "capital_loss", "hr_per_week","country", "income"))

> adult<-adult[,c(4,6,7,15)]
> head(adult)
  education            marital        occupation income
1 Bachelors      Never-married      Adm-clerical  <=50K
2 Bachelors Married-civ-spouse   Exec-managerial  <=50K
3   HS-grad           Divorced Handlers-cleaners  <=50K
4      11th Married-civ-spouse Handlers-cleaners  <=50K
5 Bachelors Married-civ-spouse    Prof-specialty  <=50K
6 Masters Married-civ-spouse Exec-managerial <=50Kadult2<-sapply(adult,function(x){
temp<-as.integer(factor(x))-1
})
nlev<-sapply(adult,function(x){
temp<-factor(x)
length(levels(temp))
})
adult2<-as.data.frame(adult2)
suffStat <- list(dm = adult2, nlev = nlev, adaptDF = FALSE)
pc.fit <- pc(suffStat, indepTest = disCItest,
alpha = 0.01,labels =names(adult2),verbose = TRUE)
pc.fit
plot(pc.fit)
该包的详细说明:
Causal Inference using Graphical Models with the Package pcalg
Package ‘pcalg’
作为分享主义者(sharism),本人所有互联网发布的图文均遵从CC版权,转载请保留作者信息并注明作者a358463121专栏:http://blog.csdn.net/a358463121,如果涉及源代码请注明GitHub地址:https://github.com/358463121/。商业使用请联系作者。