Google机器学习(二) 鸢尾花数据集(load_iris) 决策树
Google深度学习系列视频
谷歌开发者视频中文频道:https://www.youtube.com/playlist?list=PLwv-rHS37fS9s3udyMoPPpaROL4u_tF5k
____tz_zs学习笔记
一、在Spyder中写第一个机器学习的程序:
这里使用的分类器是决策树
from sklearn import tree
feature = [[140,1],[130,1],[150,0],[170,0]]
#labels = ["apple","apple","orange","orange"]
labels = [0,0,1,1]
clf = tree.DecisionTreeClassifier()
clf = clf.fit(feature,labels)
print (clf.predict([[150,0]]))
.
二、鸢尾花数据集训练决策树
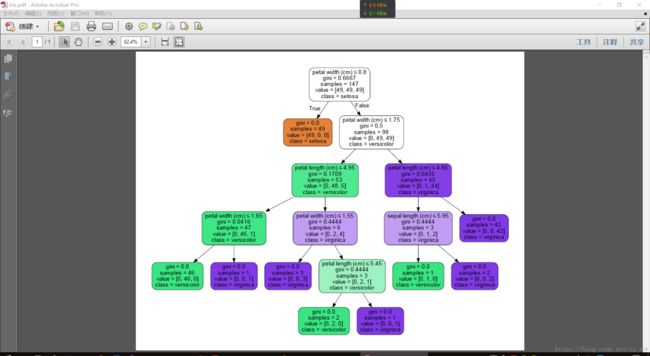
下面是根据google机器学习视频,写的鸢尾花数据集的决策树训练、测试、可视化代码
鸢尾花数据集下载:http://download.csdn.net/detail/tz_zs/9874935)
参考资料:http://cda.pinggu.org/view/3074.html
# -*- coding: utf-8 -*-
"""
Spyder Editor

This is a temporary script file.
"""
# 引入数据集
import numpy as np
from sklearn.datasets import load_iris
from sklearn import tree

iris = load_iris()
print(iris.feature_names)  # ['sepal length (cm)', 'sepal width (cm)', 'petal length (cm)', 'petal width (cm)']
print(iris.target_names)  # ['setosa' 'versicolor' 'virginica']
print(iris.data[0])  # [ 5.1  3.5  1.4  0.2]
print(iris.target[0])  # 0
test_idx = [0, 50, 100]  # 取0,50,100位置的数据作为测试集(所以这里测试集只有三组数据)

# training data
train_target = np.delete(iris.target, test_idx)
train_data = np.delete(iris.data, test_idx, axis=0)

# testing data
test_target = iris.target[test_idx]
test_data = iris.data[test_idx]

clf = tree.DecisionTreeClassifier()
clf = clf.fit(train_data, train_target)

# print(test_target)
# print(clf.predict(test_data))

# viz code 可视化 制作一个简单易读的PDF
from sklearn.externals.six import StringIO
import pydot

dot_data = StringIO()
tree.export_graphviz(clf, out_file=dot_data,
                     feature_names=iris.feature_names,
                     class_names=iris.target_names,
                     filled=True, rounded=True,
                     special_characters=True)
graph = pydot.graph_from_dot_data(dot_data.getvalue())
print(len(graph))  # 1
print(graph)  # []
print(graph[0])  #
# graph.write_pdf("iris.pdf")
graph[0].write_pdf("iris.pdf")
·pdf如图:
·
三、本项目中导入包的问题
如果你的 anaconda 的开始菜单中,没有你新建的虚拟环境的命令行入口(例中为新建了一个2.7的环境),
你需要安装如图的包,这样才能在开始菜单中看到新建的虚拟环境的命令行入口——Anaconda prompt2.7
当然,直接在cmd激活2.7的虚拟环境,或者点击如图的三角形 open terminal 也能进入anaconda命令行终端,但这样不是很方便。
.
在Anaconda命令栏中输入 pip install pydot 安装
此时已经在python2.7环境下安装好了pydot包。
补充:GraphViz 和 pydot 的问题
发现有不少小伙伴在 dot 转 PDF 时遇到了 dot 或 GraphViz 找不到等等问题。这里有几点提醒:
一、注意在Python中安装好 GraphViz (pip install graphviz)和 pydot (pip install pydot)三方库后,你还需要下载 GraphViz(https://www.graphviz.org/)软件安装。(Linux 可以在终端使用命令 sudo apt-get install graphviz 完成安装)
二、很可能是因为没把graphviz的bin目录加入path路径。
三、注意先安装 GraphViz,再安装 pydot。
参考:
- https://www.bbsmax.com/A/B0zqBekNJv/
- https://stackoverflow.com/questions/27666846/pydot-invocationexception-graphvizs-executables-not-found
- https://stackoverflow.com/questions/18438997/why-is-pydot-unable-to-find-graphvizs-executables-in-windows-8
.
end


