A = matrix(seq(1,16),4,4)
A
| 1 |
5 |
9 |
13 |
| 2 |
6 |
10 |
14 |
| 3 |
7 |
11 |
15 |
| 4 |
8 |
12 |
16 |
A[1,]
- 1
- 5
- 9
- 13
A[-c(1,3),]
dim(A)
- 4
- 4
1.数据读取、查看
getwd()
‘E:/机器学习与量化交易研究课题/统计学习导论-基于R应用/ISLR/data’
Auto = read.table("Auto.data")
fix(Auto)
Auto = read.table("Auto.data",header= T,na.strings="?")
fix(Auto)
dim(Auto)
- 397
- 9
Auto = read.csv("Auto.csv",header= T, na.strings="?")
fix(Auto)
dim(Auto)
- 397
- 9
Auto[1:5,]
| mpg |
cylinders |
displacement |
horsepower |
weight |
acceleration |
year |
origin |
name |
| 18 |
8 |
307 |
130 |
3504 |
12.0 |
70 |
1 |
chevrolet chevelle malibu |
| 15 |
8 |
350 |
165 |
3693 |
11.5 |
70 |
1 |
buick skylark 320 |
| 18 |
8 |
318 |
150 |
3436 |
11.0 |
70 |
1 |
plymouth satellite |
| 16 |
8 |
304 |
150 |
3433 |
12.0 |
70 |
1 |
amc rebel sst |
| 17 |
8 |
302 |
140 |
3449 |
10.5 |
70 |
1 |
ford torino |
Auto = na.omit(Auto) # 剔除空行
dim(Auto)
- 392
- 9
names(Auto) # 查看变量名(列名/特征)
- 'mpg'
- 'cylinders'
- 'displacement'
- 'horsepower'
- 'weight'
- 'acceleration'
- 'year'
- 'origin'
- 'name'
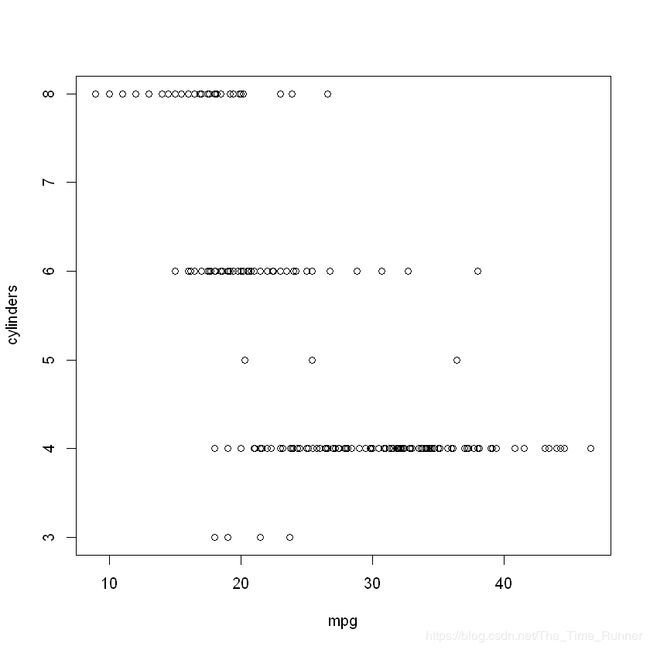
plot(mpg,cylinders) # R 不会默认数据集,需要指定
Error in plot(mpg, cylinders): 找不到对象'mpg'
Traceback:
1. plot(mpg, cylinders)
# 指定方式一
plot(Auto$mpg,Auto$cylinders)

# 指定方式二
attach(Auto)
plot(mpg, cylinders)
The following objects are masked from Auto (pos = 3):

    acceleration, cylinders, displacement, horsepower, mpg, name,
    origin, weight, year

The following objects are masked from Auto (pos = 4):

    acceleration, cylinders, displacement, horsepower, mpg, name,
    origin, weight, year

The following objects are masked from Auto (pos = 5):

    acceleration, cylinders, displacement, horsepower, mpg, name,
    origin, weight, year

The following objects are masked from Auto (pos = 6):

    acceleration, cylinders, displacement, horsepower, mpg, name,
    origin, weight, year
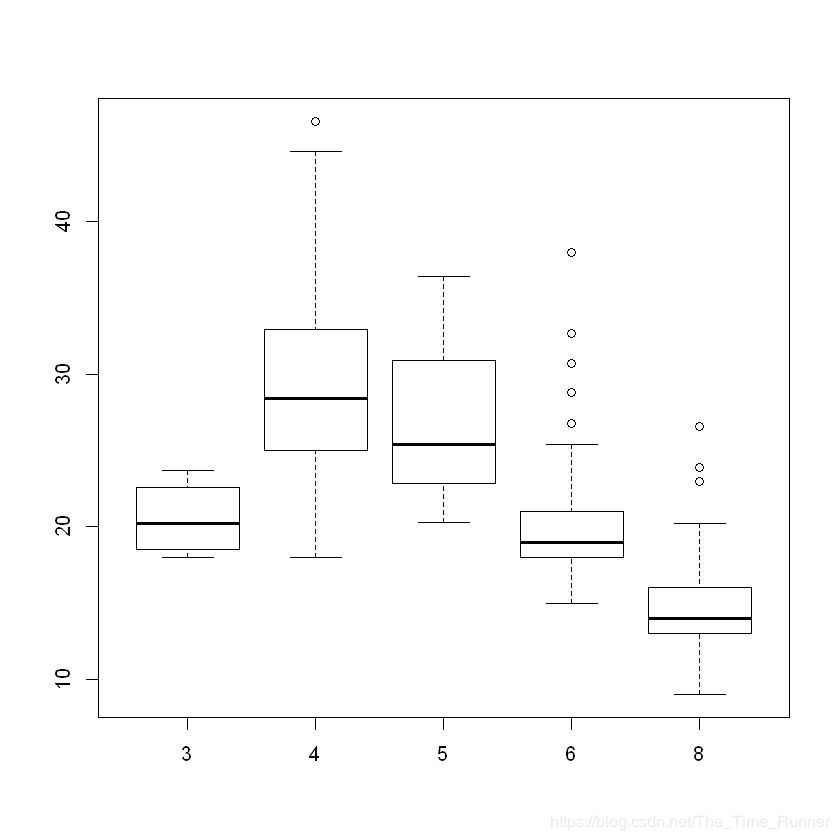
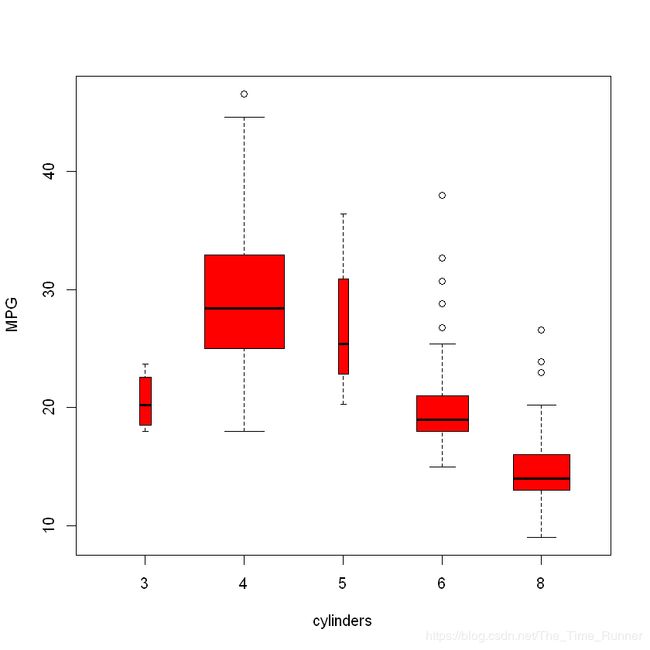
箱线图
# 将定量变量转变为定性变量(虽然是数值,但是种类比较少)
cylinders = as.factor(cylinders)
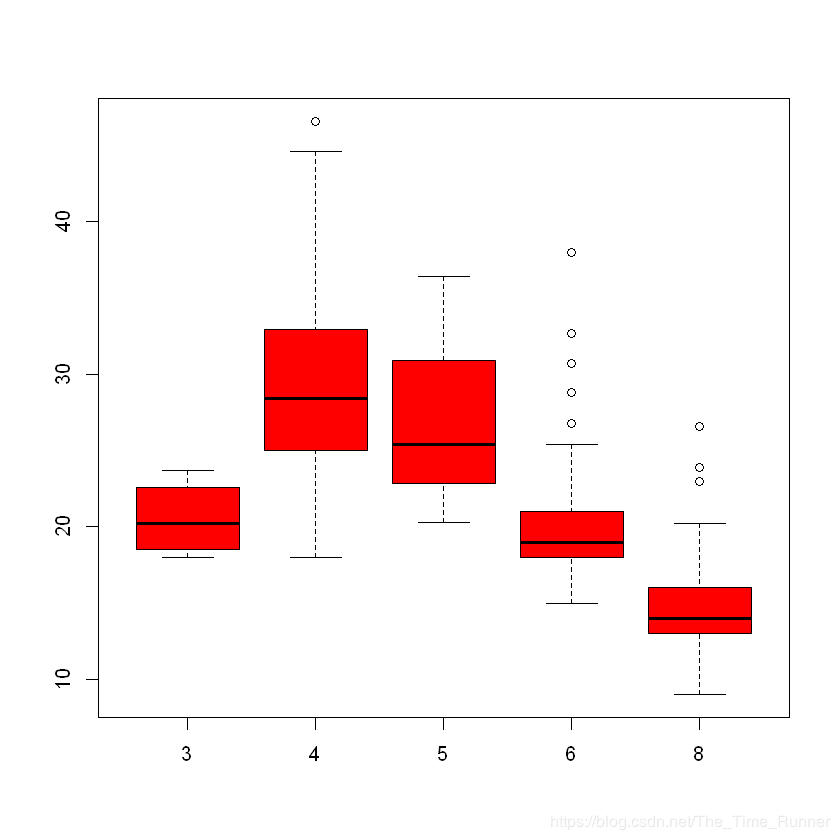
# plot()绘制的是散点图,如果X轴输入是定性变量,自动转为箱线图
plot(cylinders,mpg)
plot(cylinders,mpg,col="red")
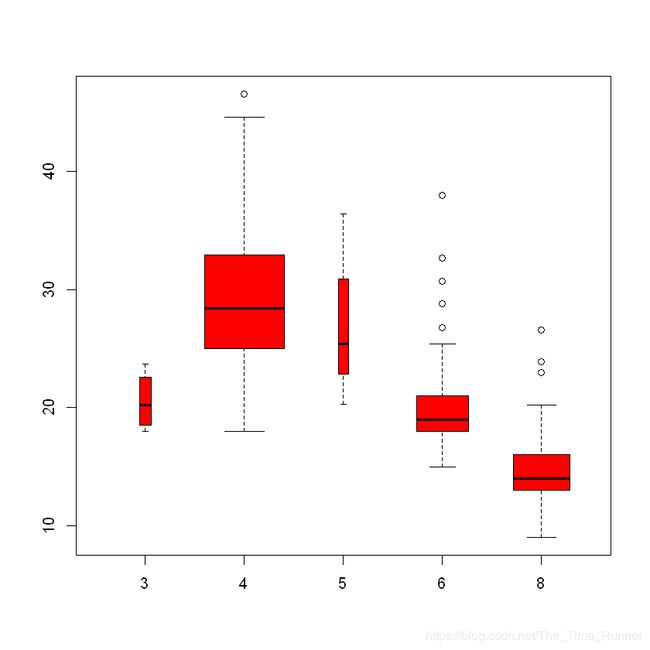
plot(cylinders,mpg,col="red", varwidth= T) # varwidth是一个逻辑值。 设置为true以绘制与样本大小成比例的框的宽度。
plot(cylinders,mpg,col="red", varwidth= T, horizontal=T)
plot(cylinders,mpg,col="red", varwidth= T, xlab= "cylinders", ylab= "MPG")

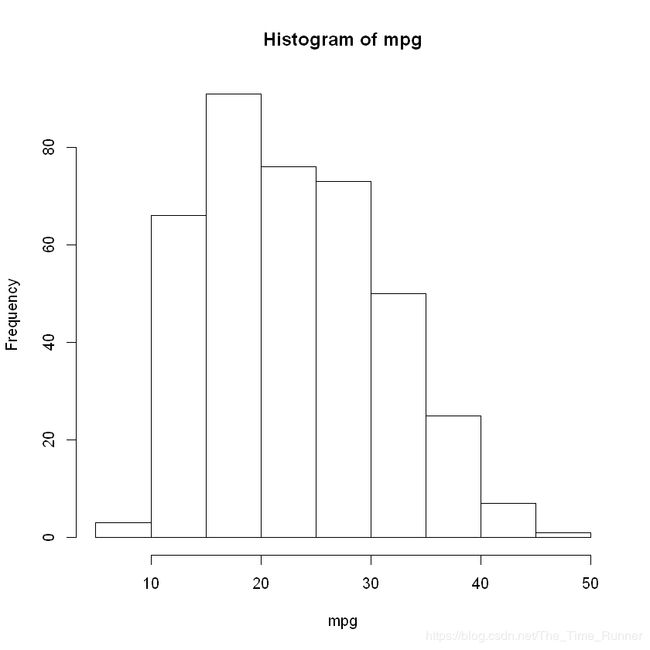
直方图
hist(mpg)
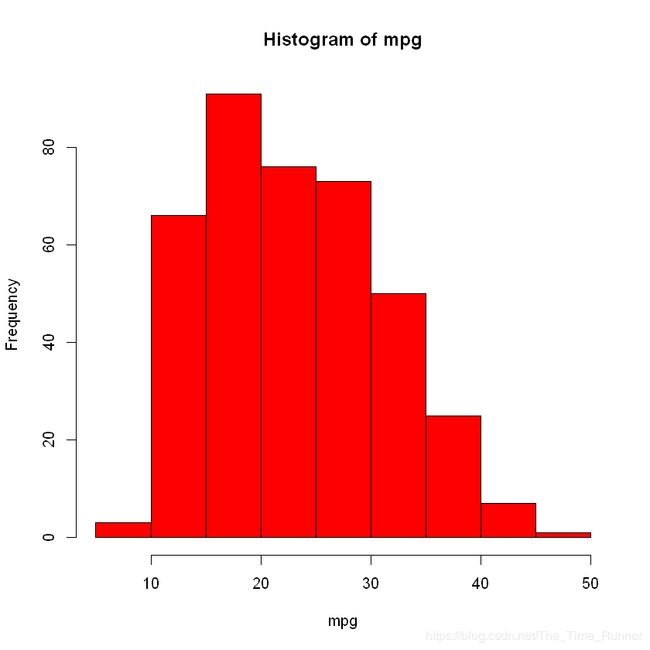
hist(mpg, col = 2)
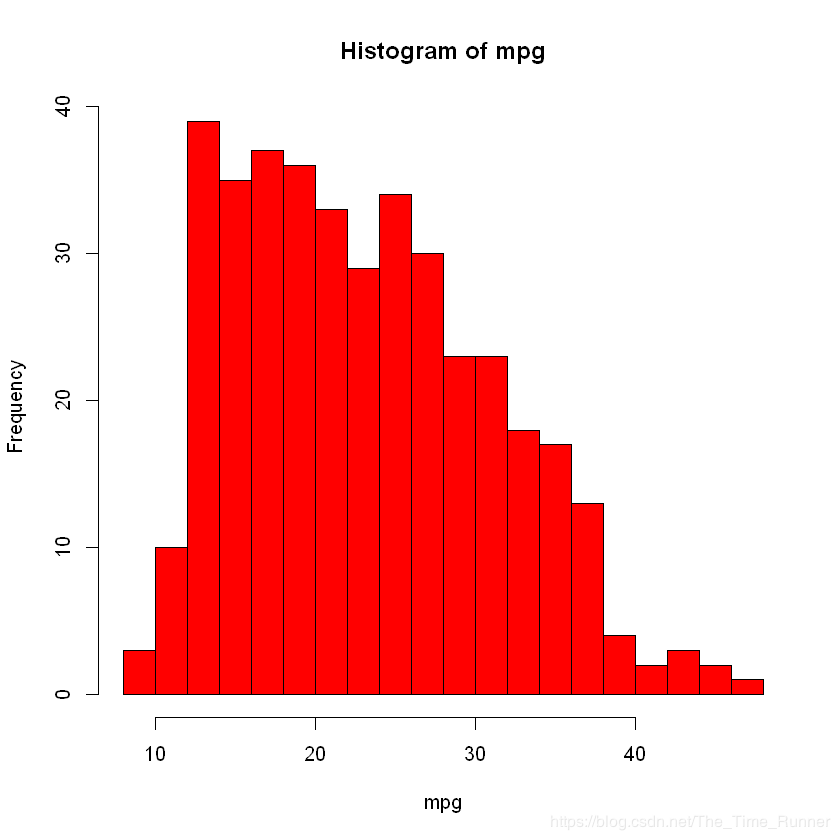
hist(mpg, col= 2, breaks = 15) # 建议的分组组数,标量R不一定会用,如需精确breaks= seq(1,6,0.5)
两两绘图
pairs(Auto) # 数据集中两两变量绘制散点图

pairs(~mpg+displacement+horsepower,Auto) # 指定子集
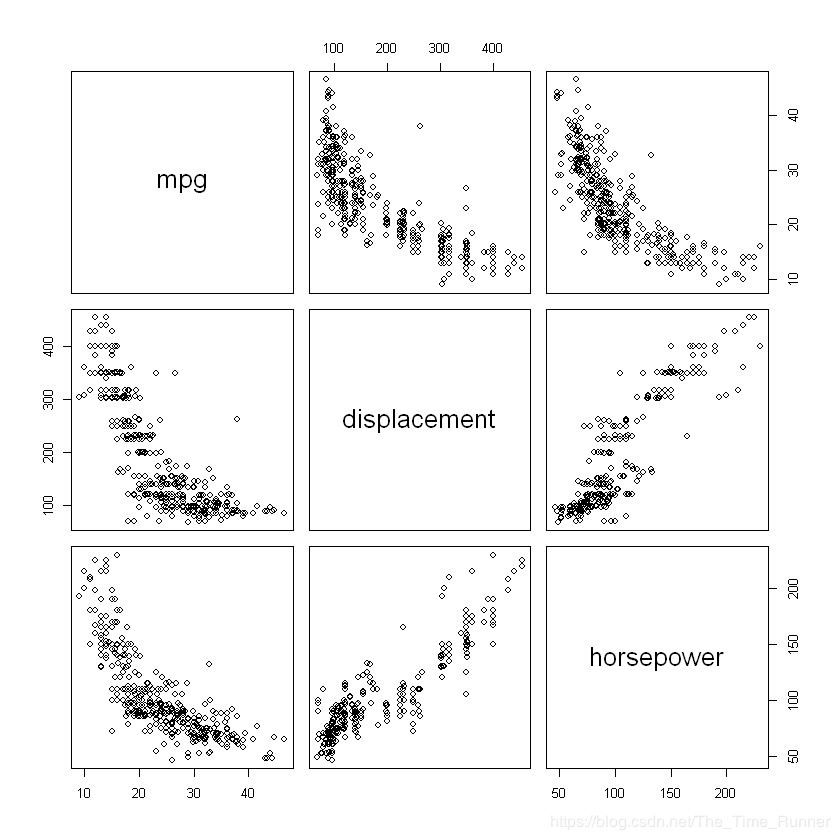
显示图中某点的某些信息
plot(horsepower,mpg)
identify(horsepower,mpg,name)

描述统计量
summary(Auto)
      mpg          cylinders      displacement     horsepower        weight
 Min.   : 9.00   Min.   :3.000   Min.   : 68.0   Min.   : 46.0   Min.   :1613
 1st Qu.:17.00   1st Qu.:4.000   1st Qu.:105.0   1st Qu.: 75.0   1st Qu.:2225
 Median :22.75   Median :4.000   Median :151.0   Median : 93.5   Median :2804
 Mean   :23.45   Mean   :5.472   Mean   :194.4   Mean   :104.5   Mean   :2978
 3rd Qu.:29.00   3rd Qu.:8.000   3rd Qu.:275.8   3rd Qu.:126.0   3rd Qu.:3615
 Max.   :46.60   Max.   :8.000   Max.   :455.0   Max.   :230.0   Max.   :5140

  acceleration        year           origin                      name
 Min.   : 8.00   Min.   :70.00   Min.   :1.000   amc matador       :  5
 1st Qu.:13.78   1st Qu.:73.00   1st Qu.:1.000   ford pinto        :  5
 Median :15.50   Median :76.00   Median :1.000   toyota corolla    :  5
 Mean   :15.54   Mean   :75.98   Mean   :1.577   amc gremlin       :  4
 3rd Qu.:17.02   3rd Qu.:79.00   3rd Qu.:2.000   amc hornet        :  4
 Max.   :24.80   Max.   :82.00   Max.   :3.000   chevrolet chevette:  4
                                                 (Other)           :365
summary(mpg)
   Min. 1st Qu.  Median    Mean 3rd Qu.    Max.
   9.00   17.00   22.75   23.45   29.00   46.60


