Python画高斯分布图 (2D, 3D)
文章目录
- n元高斯分布函数
- 导入相关包
- 生成高斯分布数据
- 二元高斯散点图
- 一元高斯概率分布图 (单变量)
- 二元高斯概率分布图 (双变量)
- 二元高斯概率分布图水平面投影
n元高斯分布函数
n元高斯分布函数公式:
f ( x ) = 1 ( 2 π ) n det Σ exp ( − 1 2 ( x − μ x ) T Σ − 1 ( x − μ x ) ) f(x) = \frac{1}{\sqrt{(2 \pi)^n \det \Sigma}} \exp\left( -\frac{1}{2} (x - \mu_x)^T \Sigma^{-1} (x - \mu_x) \right) f(x)=(2π)ndetΣ1exp(−21(x−μx)TΣ−1(x−μx))
其中 x x x是 n n n元变量
导入相关包
import numpy as np
import matplotlib.pyplot as plt
from scipy.stats import multivariate_normal
from mpl_toolkits.mplot3d import Axes3D
%matplotlib inline
生成高斯分布数据
def Gaussian_Distribution(N=2, M=1000, m=0, sigma=1):
    '''
    Parameters
    ----------
    N 维度
    M 样本数
    m 样本均值
    sigma: 样本方差

    Returns
    -------
    data  shape(M, N), M 个 N 维服从高斯分布的样本
    Gaussian  高斯分布概率密度函数
    '''
    mean = np.zeros(N) + m  # 均值矩阵,每个维度的均值都为 m
    cov = np.eye(N) * sigma  # 协方差矩阵,每个维度的方差都为 sigma

    # 产生 N 维高斯分布数据
    data = np.random.multivariate_normal(mean, cov, M)
    # N 维数据高斯分布概率密度函数
    Gaussian = multivariate_normal(mean=mean, cov=cov)

    return data, Gaussian
二元高斯散点图
'''二元高斯散点图'''
data, _ = Gaussian_Distribution(N=2, M=10000)
x, y = data.T
plt.scatter(x, y)
plt.show()
一元高斯概率分布图 (单变量)
'''一元高斯概率分布图'''
_, Gaussian = Gaussian_Distribution(N=1, M=1000, sigma=0.1)
x = np.linspace(-1,1,1000)
# 计算一维高斯概率
y = Gaussian.pdf(x)
plt.plot(x, y)
plt.show()
二元高斯概率分布图 (双变量)
M = 1000
data, Gaussian = Gaussian_Distribution(N=2, M=M, sigma=0.1)
# 生成二维网格平面
X, Y = np.meshgrid(np.linspace(-1,1,M), np.linspace(-1,1,M))
# 二维坐标数据
d = np.dstack([X,Y])
# 计算二维联合高斯概率
Z = Gaussian.pdf(d).reshape(M,M)


'''二元高斯概率分布图'''
fig = plt.figure(figsize=(6,4))
ax = Axes3D(fig)
ax.plot_surface(X, Y, Z, rstride=1, cstride=1, cmap='seismic', alpha=0.8)
ax.set_xlabel('X')
ax.set_ylabel('Y')
ax.set_zlabel('Z')
plt.show()
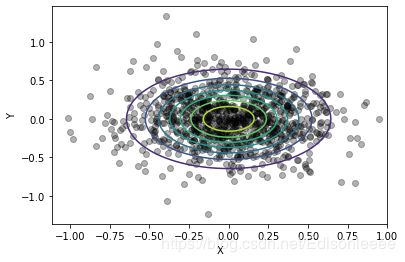
二元高斯概率分布图水平面投影
'''二元高斯概率分布图水平面投影'''
plt.figure()
plt.xlabel("X")
plt.ylabel("Y")
x, y = data.T
plt.plot(x, y, 'ko', alpha=0.3)
plt.contour(X, Y, Z,  alpha =1.0, zorder=10);
plt.show()


