Python Plot+Bokeh画图并保存为图片或网页
近来学习了下python matplotlib绘图,其功能還是很强大的。
由于需要在一张图上展示多个子图,所以用到subplot,python 绘制这种图的方式有很多種,这里介紹其中一种方法:
1.第一种画图plt.subplots()
import numpy as np
import matplotlib.pyplot as plt
plt.rcParams['font.sans-serif'] = ['SimHei']  # 用来正常显示中文标签
plt.rcParams['axes.unicode_minus'] = False  # 用来正常显示负号
plt.style.use('ggplot') #可以绘制出ggplot的风格
# 给出x,y值
x = np.linspace(0, 2 * np.pi, 400)
y = np.sin(x ** 2)

#只画一个图
f, ax = plt.subplots()
ax.set_title('Simple sin_plot')
ax.plot(x, y)
plt.show()
p1= r'E:\\test1.png'# 图片保存路径
plt.savefig(p1)# 保存图片plt.subplots(nrows=1, ncols=1, sharex=False, sharey=False, squeeze=True, subplot_kw=None, gridspec_kw=None, **fig_kw)plt.subplots函数返回了一个figure对象和一个包含nrows * ncols的子图的Axes objects数组,默认返回一个Axes object(matplotlib.axes.Axes 对象)。为如何创建个别块提供合理的控制。
- plt.subplots
参看:matplotlib.pyplot.subplots
- 图片保存savefig
其中保存图片可参看:matplotlib.pyplot.savefig
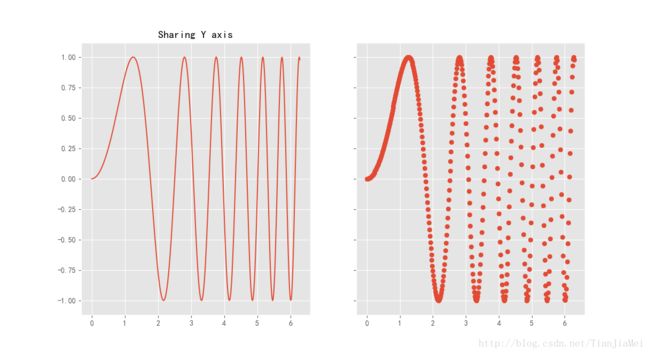
其中sharex,sharey属性为设置子图是否共享x y轴。
f, ax = plt.subplots(1, 2, sharey=True)
#f, ax = plt.subplots(2, sharey=True)效果同上
# 此时的ax为一个Axes对象数组,包含两个对象
ax[0].set_title('Sharing Y axis')
ax[0].plot(x, y)
ax[1].scatter(x, y)
plotPath= r'E:\test\sharey.png' # 图片保存路径
plt.savefig(plotPath)   # 保存图片
2.Bokeh绘图并保存为网页
首先需要安装bokeh包,使用命令:
pip install bokeh
使用bokeh绘图保存为网页后,网页中可以实现拖拽等功能,而以上保存为的图片则不能
from bokeh.plotting import figure, output_file, show
from bokeh.io import save  #引入保存函数
from bokeh.layouts import gridplot
lb = 'test'
tools = "pan,box_zoom,reset,save"  #网页中显示的基本按钮:保存,重置等
plots = []
path = r"d:\test\bokehTest.html"  #保存路径
output_file(path)
x = list(range(11))
y0 = x
y1 = [10 - i for i in x]
y2 = [abs(i - 5) for i in x]

# create a new plot
s1 = figure(plot_width=250, plot_height=600, title=None)
s1.circle(x, y0, size=6, color="navy", alpha=0.5)

# create another one
s2 = figure(plot_width=250, plot_height=600, title=None)
s2.triangle(x, y1, size=10, color="firebrick", alpha=0.5)

#将以上两个图以列的形式展示在页面上

show(column(s1, s2))
# 使以上两个图在同一行,展示在页面上
# show(row(s1, s2))
# grid = gridplot([s1, s2])效果同column(s1, s2)
# show the results
# show(grid)

save(obj=column(s1, s2), filename=path, title="outputTest")
# save 之前必须有output_file才可以保存成功:This output file will be #overwritten on every save, e.g., each time show() or save() is invoked.
- tools
参考:bokeh-tools - output_file()
参考:bokeh.io.output_file
先暂时写到这里,希望能够记录自己编码过程中的点滴,也希望能够为遇到同样问题的你提供些帮助。

