Solutions:Elastic SIEM - 适用于家庭和企业的安全防护 ( 二)
这篇文章是之前的文章“Solutions:Elastic SIEM - 适用于家庭和企业的安全防护 ( 一)”的续篇。在之前的那篇文章中,我们对Elastic SIEM做了一个简单的介绍。在这篇文章中,我们来继续之前的话题。我们来进行实操。
认识Elastic SIEM
在我们进行这个SIEM系列的博客的过程,随着各种设备添加到Elasticsearch部署中时,我们将能够在新的SIEM应用程序中查看数据。 这是来自具有七个系统的环境中的“主机和网络”页面的示例:

SIEM应用的Hosts示范页面

SIEM应用的Network示范页面
在阅读本系列文章时,我们将逐步介绍如何从不同的设备收集数据并将其发送到我们的Elasticsearch部署中。 在接下来的几篇文章中,我们将在Elastic SIEM中探索该数据。 我们的目标是涵盖以下主题:
- 将GeoIP数据添加到我们的网络事件中
- 确保对我们的Elastic集群的安全访问
- 从Windows和Linux设备配置数据收集
- 收集防火墙和DNS服务器数据
- 在Elastic Maps中可视化GeoIP数据。 我们还将利用Elastic Maps应用程序对数据进行更高级的可视化(即使Elastic Stack 7.4版在SIEM应用程序中包含地图)。
- 配置其他数据源并处理更高级的用例
这是您浏览这些博客后可以创建的一种可视化示例:

好的,让我们详细了解两个用例的环境,创建我们的Elasticsearch部署,并最后确定一些相关的技术项目。 一旦我们的Elasticsearch部署准备就绪,我们将在本系列的后续博客中介绍配置从工作站,便携式计算机和网络设备收集数据的过程。
安装Elastisearch及Kibana
对于我们的测试环境,我们可以有几种选择:
- 安装本机的Elastic Stack。您可以参阅我之前的文章“Elastic:菜鸟上手指南”来进行安装Elasticsearch及Kibana
- 安装Elastic Cloud:您可以参阅我之前的文章“在Elastic云上3分钟部署Elastic集群”来部署Elastic Stack。你也可以参考我录的视频教程
- 安装阿里Elastic集群:您可以参阅文章“如何在阿里云上构建Elastic集群”
- 安装AWS Elastic集群:您可以参阅文章“如何在AWS上一步一步地安装Elastic Stack”
在今天的练习中,我将主要以本机的Elastic Stack来来讲述。针对其它的环境,基本都是一样的。
测试环境
我的测试环境如下:

在上面的环境中,我在MacOS机器上安装Elasticsearch及Kibana,而在另外两台虚拟机中安装Ubuntu OS 18.04及Windows 10。
Elasticsearch
我按照文档“如何在Linux,MacOS及Windows上进行安装Elasticsearch”安装Elasticsearch。但是为了能够让我的Elasticsearch能被其它的虚拟机中被访问,我对Elasticsearch的配置文件config/elasticsearch.yml做了如下的配置:
cluster.name: elasticsearch
node.name: node1
network.host: _site_
cluster.initial_master_nodes: ["node1"]
在上面,我们命名cluster.name为elasticsearch,并给予这个node的名字为node1。如果大家对上面的network.host被定义为_site_不太理解的话,可以参阅文档。它的意思就是把elasticsearch的9200绑定于所有的网络接口。修改完上面的elasticsearch.yml文件后,我们重新启动Elasticsearch,我们可以看到:
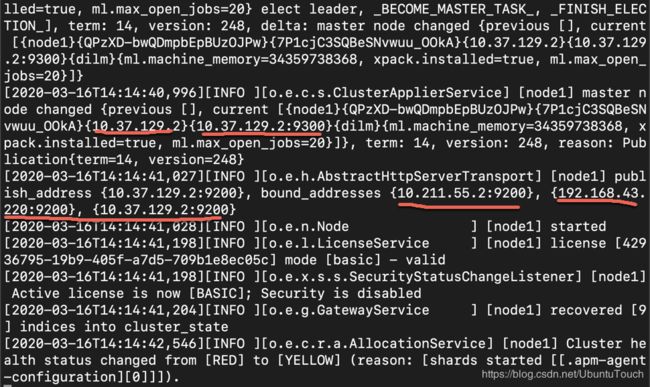
上面显示9200端口已经成功地绑定于目前所有的网络的地址上了。我们可以通过如下的命令来查看我们的网路接口:
ifconfig我们可以分别在我们的浏览器中输入上面的9200端口的地址。如果你能看到输出,则表明我们的安装时正确的。

Kibana
我们根据文章“如何在Linux,MacOS及Windows上安装Elastic栈中的Kibana”来安装Kibana。为了能够访问我们上面安装的Elasticsearch,我们需要在默认的Kibana中做相应的调整。我们来修改config/kibana.yml文件:
server.host: "192.168.43.220"
elasticsearch.hosts: ["http://192.168.43.220:9200"]
请用自己环境里的host的名字来做替换,同时也需要根据自己的Elasticsearch的IP地址来进行相应的修改。等我们修改完后,我们来重新启动我们的Kibana。在我们的浏览器中,我们输入相应的IP:5601来查看安装是否正确:

如果能看到上面的输出,则表明我们的Kibana安装已经正确。
安装数据采集器
确定我们的数据收集需求
在下载,安装或配置任何东西之前,我们需要确定数据收集需求。我们还需要确定我们的GeoIP数据,以便能够在Elastic SIEM应用程序或Elastic Maps应用程序中利用地图功能。对于范围内的设备,我们将包括所有台式计算机和笔记本电脑,还包括小型企业拥有的Windows和Linux服务器。
为了从服务器,工作站和便携式计算机收集数据,我们将使用某些Elastic Beats应用程序。我们需要收集日志文件,用户和进程的活动以及网络数据。由于我们的用例同时具有Windows和Linux设备,因此我们需要确定哪些Beats应用程序满足我们的需求。在较高的层次上,这是每个Elastic Beats的概述:
- Auditbeat:审核用户和进程的活动(主要用于Linux系统)
- Filebeat:监视您指定的日志文件或位置,收集日志事件
- heartbeat:通过主动探测监控服务的可用性
- Metricbeat:从操作系统和正在运行的服务收集指标
- Packetbeat:实时网络数据包分析器
- Winlogbeat:Windows特定的事件日志传送代理
基于此概述,我们将需要通过下载和配置这些数据传送应用程序来使用Auditbeat,Filebeat,Packetbeat和Winlogbeat收集数据。
此博客中,我们将使用Winlogbeat配置Windows事件的默认集合。在博客系列的后面,我们将更新配置以涵盖我们的用例。
关于Beats配置,我们需要牢记Beats的配置具有共享的常规配置(除了常规配置外,每个配置还具有各自的特定设置),因此在将Beats部署到我们的系统时,我们将使用第一个系统中的配置来配置其它的系统。
确定我们的GeoIP数据
在安装和配置Beats之前,我们将要确定是否要将GeoIP数据添加到每个Beats配置中,因为我们将在配置文件中使用该数据。 就我们的机器而言,我们的小型企业(或家)位于北京市,我们的位置是纬度39.931854,经度116.470528,我们的大陆是Asia,我们国家的ISO代码是CN,我们的地区名称是Beijing, 我们区域的ISO代码是CN-BJ。
运用以上的信息,我们主机的GeoIP信息将是:
processors:
  - add_host_metadata:
      netinfo.enabled: true
      geo: # These Geo configurations are optional
        location: 39.931854, 116.470528
        continent_name: Asia
        country_iso_code: CN
        region_name: Beijing
        region_iso_code: CN-BJ
        city_name: Beijing city
        name: myLocation
  - add_locale: ~
  - add_cloud_metadata: ~
  - add_fields:
      when.network.source.ip: private
      fields:
        source.geo.location:
          lat: 39.931854
          lon: 116.470528
        source.geo.continent_name: Asia
        source.geo.country_iso_code: CN
        source.geo.region_name: Beijing
        source.geo.region_iso_code: CN-BJ
        source.geo.city_name: Beijing city
        source.geo.name: myLocation
      target: ''
  - add_fields:
      when.network.destination.ip: private
      fields:
        destination.geo.location:
          lat: 39.931854
          lon: 116.470528
        destination.geo.continent_name: Asia
        destination.geo.country_iso_code: CN
        destination.geo.region_name: Beijing
        destination.geo.region_iso_code: CN-BJ
        destination.geo.city_name: Beijing city
        destination.geo.name: myLocation
      target: ''
尽管我们会在配置文件中看到重复的信息,但它们很重要,因为它们使Beats可以告诉Elasticsearch我们的私有网络在地图上的位置。
现在我们已经准备好GeoIP数据,让我们开始在第一台家用或企业计算机上安装和配置Beats。
安装Winlogbeat
接下来,我们来安装Winlogbeat。我们将通读“Beats:如何使用Winlogbeat”以开始使用。在这里,我们需要来修改我们的winlogbeat.yml文件。我们除了按照上面来修改我们的processor之外,我们还必须根据我们的配置来进行Kibana及Elasticsearch的配置:
setup.kibana:

  # Kibana Host
  # Scheme and port can be left out and will be set to the default (http and 5601)
  # In case you specify and additional path, the scheme is required: http://localhost:5601/path
  # IPv6 addresses should always be defined as: https://[2001:db8::1]:5601
  host: "192.168.43.220:5601"

output.elasticsearch:
  # Array of hosts to connect to.
  hosts: ["10.211.55.2:9200"]

monitoring.enabled: true
在上面我们需要根据我们自己的host的IP地址进行修改。在Windows环境下,我们可以通过如下的命令来寻找当前的IP地址。上面的IP地址是在我们的MacOS host运行的Elasticsearch及Kibana IP地址。安装Winlogbeat之后,在完成初始配置之前,请不要启动该服务。
打开了一个管理PowerShell会话。 我们将通过发出 .\install-service-winlogbeat.ps1命令(如下所示)来安装该服务:

上面显示我们有一个禁止运行此脚本的错误信息。我们必须 Unblock-File 命令来对这个命令对install-service-winlogbeat.ps1进行处理。最后显示的结果如下:
PowerShell.exe -ExecutionPolicy UnRestricted -File .\install-service-winlogbeat.ps1 
这样我们就安装好winlogbeat为一个服务。我们在接下来回利用这个服务,使之在开机时启动。
我们运行:
 .\winlogbeat.exe setup                                                     Overwriting ILM policy is disabled. Set `setup.ilm.overwrite:true` for enabling.

Index setup finished.
Loading dashboards (Kibana must be running and reachable)
Exiting: error connecting to Kibana: fail to get the Kibana version: HTTP GET request to http://10.211.55.2:5601/api/status fails: fail to execute the HTTP GET request: Get http://10.211.55.2:5601/api/status: dial tcp 10.211.55.2:5601: connectex: No connection could be made because the target machine actively refused it.. Response: .
PS C:\beats\winlogbeat-7.6.1-windows-x86_64> .\winlogbeat.exe setup                                                     Overwriting ILM policy is disabled. Set `setup.ilm.overwrite:true` for enabling.

Index setup finished.
Loading dashboards (Kibana must be running and reachable)
Loaded dashboards
然后我们运行:
.\winlogbeat.exe -e -c winlogbeat.yml这个时候打开我们的Kibana,我们可以看到winlogbeat的index:

我们对收集上来的数据进行查看:
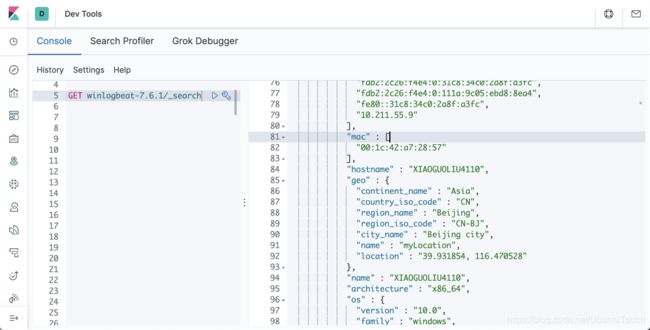
从上面我们可以看出来我们之前添加的processor已经起作用了。我们可以看到收集的geo信息。我们最终的winlogbeat.yml文件如下:
###################### Winlogbeat Configuration Example ########################

# This file is an example configuration file highlighting only the most common
# options. The winlogbeat.reference.yml file from the same directory contains
# all the supported options with more comments. You can use it as a reference.
#
# You can find the full configuration reference here:
# https://www.elastic.co/guide/en/beats/winlogbeat/index.html

#======================= Winlogbeat specific options ===========================

# event_logs specifies a list of event logs to monitor as well as any
# accompanying options. The YAML data type of event_logs is a list of
# dictionaries.
#
# The supported keys are name (required), tags, fields, fields_under_root,
# forwarded, ignore_older, level, event_id, provider, and include_xml. Please
# visit the documentation for the complete details of each option.
# https://go.es.io/WinlogbeatConfig
winlogbeat.event_logs:
  - name: Application
    ignore_older: 72h

  - name: System

  - name: Security
    processors:
      - script:
          lang: javascript
          id: security
          file: ${path.home}/module/security/config/winlogbeat-security.js

  - name: Microsoft-Windows-Sysmon/Operational
    processors:
      - script:
          lang: javascript
          id: sysmon
          file: ${path.home}/module/sysmon/config/winlogbeat-sysmon.js

#==================== Elasticsearch template settings ==========================

setup.template.settings:
  index.number_of_shards: 1
  #index.codec: best_compression
  #_source.enabled: false


#================================ General =====================================

# The name of the shipper that publishes the network data. It can be used to group
# all the transactions sent by a single shipper in the web interface.
name: liuxg

# The tags of the shipper are included in their own field with each
# transaction published.
tags: ["Home", "WorkPC"]

# Optional fields that you can specify to add additional information to the
# output.
#fields:
#  env: staging


#============================== Dashboards =====================================
# These settings control loading the sample dashboards to the Kibana index. Loading
# the dashboards is disabled by default and can be enabled either by setting the
# options here or by using the `setup` command.
#setup.dashboards.enabled: false

# The URL from where to download the dashboards archive. By default this URL
# has a value which is computed based on the Beat name and version. For released
# versions, this URL points to the dashboard archive on the artifacts.elastic.co
# website.
#setup.dashboards.url:

#============================== Kibana =====================================

# Starting with Beats version 6.0.0, the dashboards are loaded via the Kibana API.
# This requires a Kibana endpoint configuration.
setup.kibana:

  # Kibana Host
  # Scheme and port can be left out and will be set to the default (http and 5601)
  # In case you specify and additional path, the scheme is required: http://localhost:5601/path
  # IPv6 addresses should always be defined as: https://[2001:db8::1]:5601
  host: "192.168.43.220:5601"

  # Kibana Space ID
  # ID of the Kibana Space into which the dashboards should be loaded. By default,
  # the Default Space will be used.
  #space.id:

#============================= Elastic Cloud ==================================

# These settings simplify using Winlogbeat with the Elastic Cloud (https://cloud.elastic.co/).

# The cloud.id setting overwrites the `output.elasticsearch.hosts` and
# `setup.kibana.host` options.
# You can find the `cloud.id` in the Elastic Cloud web UI.
#cloud.id:

# The cloud.auth setting overwrites the `output.elasticsearch.username` and
# `output.elasticsearch.password` settings. The format is `:`.
#cloud.auth:

#================================ Outputs =====================================

# Configure what output to use when sending the data collected by the beat.

#-------------------------- Elasticsearch output ------------------------------
output.elasticsearch:
  # Array of hosts to connect to.
  hosts: ["10.211.55.2:9200"]

  # Protocol - either `http` (default) or `https`.
  #protocol: "https"

  # Authentication credentials - either API key or username/password.
  #api_key: "id:api_key"
  #username: "elastic"
  #password: "changeme"

#----------------------------- Logstash output --------------------------------
#output.logstash:
  # The Logstash hosts
  #hosts: ["localhost:5044"]

  # Optional SSL. By default is off.
  # List of root certificates for HTTPS server verifications
  #ssl.certificate_authorities: ["/etc/pki/root/ca.pem"]

  # Certificate for SSL client authentication
  #ssl.certificate: "/etc/pki/client/cert.pem"

  # Client Certificate Key
  #ssl.key: "/etc/pki/client/cert.key"

#================================ Processors =====================================

# Configure processors to enhance or manipulate events generated by the beat.
processors:
  - add_host_metadata:
      netinfo.enabled: true
      geo: # These Geo configurations are optional
        location: 39.931854, 116.470528
        continent_name: Asia
        country_iso_code: CN
        region_name: Beijing
        region_iso_code: CN-BJ
        city_name: Beijing city
        name: myLocation
  - add_locale: ~
  - add_cloud_metadata: ~
  - add_fields:
      when.network.source.ip: private
      fields:
        source.geo.location:
          lat: 39.931854
          lon: 116.470528
        source.geo.continent_name: Asia
        source.geo.country_iso_code: CN
        source.geo.region_name: Beijing
        source.geo.region_iso_code: CN-BJ
        source.geo.city_name: Beijing city
        source.geo.name: myLocation
      target: ''
  - add_fields:
      when.network.destination.ip: private
      fields:
        destination.geo.location:
          lat: 39.931854
          lon: 116.470528
        destination.geo.continent_name: Asia
        destination.geo.country_iso_code: CN
        destination.geo.region_name: Beijing
        destination.geo.region_iso_code: CN-BJ
        destination.geo.city_name: Beijing city
        destination.geo.name: myLocation
      target: ''
#================================ Logging =====================================

# Sets log level. The default log level is info.
# Available log levels are: error, warning, info, debug
#logging.level: debug

# At debug level, you can selectively enable logging only for some components.
# To enable all selectors use ["*"]. Examples of other selectors are "beat",
# "publish", "service".
#logging.selectors: ["*"]

#============================== X-Pack Monitoring ===============================
# winlogbeat can export internal metrics to a central Elasticsearch monitoring
# cluster.  This requires xpack monitoring to be enabled in Elasticsearch.  The
# reporting is disabled by default.

# Set to true to enable the monitoring reporter.
monitoring.enabled: true

# Sets the UUID of the Elasticsearch cluster under which monitoring data for this
# Winlogbeat instance will appear in the Stack Monitoring UI. If output.elasticsearch
# is enabled, the UUID is derived from the Elasticsearch cluster referenced by output.elasticsearch.
#monitoring.cluster_uuid:

# Uncomment to send the metrics to Elasticsearch. Most settings from the
# Elasticsearch output are accepted here as well.
# Note that the settings should point to your Elasticsearch *monitoring* cluster.
# Any setting that is not set is automatically inherited from the Elasticsearch
# output configuration, so if you have the Elasticsearch output configured such
# that it is pointing to your Elasticsearch monitoring cluster, you can simply
# uncomment the following line.
#monitoring.elasticsearch:

#================================= Migration ==================================

# This allows to enable 6.7 migration aliases
#migration.6_to_7.enabled: true
运行Winlogbeat作为一个服务
现在该启动Winlogbeat服务了! 在我们的管理PowerShell会话中,我们将发出Start-Service winlogbeat命令(请参见下文)以开始从该设备收集Windows应用程序,系统和安全日志。我们停止winlogbeat的运行,然后使用如下的命令来启动这个服务:
Start-Service winlogbeat我们可以通过如下的命令来查看我们的winlogbeat的服务运行情况:
Get-Service winlogbeat 
上面显示,我们的winlogbeat服务正在运行。我们可以通过如下的命令来停止winlogbeat服务的运行:
Stop-Service winlogbeat
展示SIEM应用
在上面我们已经成功地把我们的Windows的数据传入到Elasticsearch中了。现在该是我们展示数据的时候了。我们打开Kibana,并点击SIEM应用:

在上面我们可以看到目前有一个host,用户有392次的登录,而且无一失败。它有一个唯一的IP:

我们可以点击上面的XIAGUOLIU4100链接,我们可以看到这个host的所有的详细的信息:


我们可以看到所有的登录的情况。
我们也可以点击Network来查看网路的使用情况:


目前我们没有做很多的网路访问,所以没有很多的数据。
好了,今天我们的演示就到这里了。在接下来的文章里,我们会安装auditbeat及packetbeat来收集更多的信息。敬请阅读“Solutions:Elastic SIEM - 适用于家庭和企业的安全防护 ( 三)”。
参考
【1】https://www.elastic.co/webinars/introducing-elastic-siem