基于笛卡尔网格的三维流动数值模拟,其流场信息可以通过tecplot格式进行输出,方便tecplot对流场进行可视化处理,但对数据进行在加工时,还是导入matlab中比较方便,那么对于一个tecplot数据文件,matlab是不能直接读取的,必须有一个函数将tecplot数据文件中数据转换成matlab便于操作的数据格式。
tecplot数据文件前三行是文件头,其中第一行是数据文件说明,第二行中是文件中所定义的变量名,第三行,对于笛卡尔网格的流场,其包含了每个空间方向上离散的数据数目。通过处理第二行文本,可以获取所定义的变量及其数目。
tecplot文件中数据一行是一个记录,一行中数据的顺序和文件头中第二行定义的变量顺序相对应,通常前三个数据是x,y,z,对应网格点空间位置。
Title= "simulation data"
VARIABLES= "X","Y","Z","U","V","W","RHO"
ZONE T= "BOX",I= 100,J=321,K=100,F= POINT
0 0 0 0.000252868 0.00386761 -0.00194455 1000.01
1 0 0 -0.000252631 -0.00258331 0.00188909 1000.01
2 0 0 0.000252594 0.00441002 -0.00183506 1000.01
3 0 0 -0.000252256 -0.0019755 0.00178188 1000
4 0 0 0.000252931 0.00492305 -0.00173004 1000
...
1、matlab读取tecplot文件,通过读取文件头获取文件所定义变量以及变量数目,同时读取文件中所包含数据信息,所读取的数据保存在一个四维数组中,最后一个维度代表每个变量,变量名保存在一个元胞数组中。
1.1 tecplot数据为空间三维流场,tecplot2mat_3D
% read data from tecplot file, and save the variables to mat
% filename: the name of the tecplot file including the extensions
% var: the data of variables, is a four dimensions array, the last dimension is the the number of variable
% var_name: the name of the variables, is a cell
% var_num: the number of the variables
function [var,var_name,var_num] = tecplot2mat_3D(filename)
%% tecplot data file read
% open the file
fid = fopen(filename);

% read the second line of data file
[~] = fgetl(fid);
str = fgetl(fid);

% get the number of the variables
o1 = regexpi(str,'"','start');
var_num = length(o1)/2;

% get the name of the variables
var_name = cell(1,var_num);
for i = 1:var_num
    var_name{1,i} = str(o1(2*i-1)+1:o1(2*i)-1);
end

% read the data
strformat = repmat('%f',1,var_num);
data = textscan(fid,strformat,'headerlines',1);
data = cell2mat(data);

% close the file
fclose(fid);

%% reshape data
% get discrete points
xi = sort(unique(data(:,1)));
yi = sort(unique(data(:,2)));
zi = sort(unique(data(:,3)));

% number of the discrete points
num_x = length(xi);
num_y = length(yi);
num_z = length(zi);

% initialize the three demonsions array
var = zeros(num_x,num_y,num_z,var_num);

% assignment the array according to the data
for n = 1:size(data,1)
    % method 1: we don't know the relationship between the number and the index, we must find the index according to the value
    %     index_x = find( data(n,1) == xi );
    %     index_y = find( data(n,2) == yi );
    %     index_z = find( data(n,3) == zi );

    % method 2: we know the relationship between the value and the index, we can directly access the index
    index_x = data(n,1) + 1;
    index_y = data(n,2) + 1;
    index_z = data(n,3) + 1;

    % access the data
    for i = 1:var_num
        var(index_x,index_y,index_z,i) = data(n,i);
    end
end

fprintf('reshape the data\n');

%% data save to mat
index_str = find( '.' == filename );
if isempty(index_str)
else
    filename = filename( 1:index_str-1 );
end
eval(['save ',filename,'.mat var var_name var_num;']);

fprintf('save the data\n');
end
1.2 tecplot数据为空间二维流场,tecplot2mat_2D
% read data from tecplot file, and save the variables to mat
% filename: the name of the tecplot file including the extensions
% var: the data of variables, is a three dimensions array, the last dimension is the the number of variable
% var_name: the name of the variables, is a cell
% var_num: the number of the variables, is a number
function [var,var_name,var_num] = tecplot2mat_2D(filename)
%% tecplot data file read
% open the file
fid = fopen(filename);

% read the second line of data file
[~] = fgetl(fid);
str = fgetl(fid);

% get the number of the variables
o1 = regexpi(str,'"','start');
var_num = length(o1)/2;

% get the name of the variables
var_name = cell(1,var_num);
for i = 1:var_num
    var_name{1,i} = str(o1(2*i-1)+1:o1(2*i)-1);
end

% read the data
strformat = repmat('%f',1,var_num);
data = textscan(fid,strformat,'headerlines',1);
data = cell2mat(data);

% close the file
fclose(fid);

%% reshape data
% get discrete points
xi = sort(unique(data(:,1)));
yi = sort(unique(data(:,2)));

% number of the discrete points
num_x = length(xi);
num_y = length(yi);

% initialize the three demonsions array
var = zeros(num_x,num_y,var_num);

% assignment the array according to the data
for n = 1:size(data,1)
    % method 1: we don't know the relationship between the number and the index, we must find the index according to the value
    %     index_x = find(data(n,1) == xi);
    %     index_y = find(data(n,2) == yi);

    % method 2: we know the relationship between the value and the index, we can directly access the index
    index_x = data(n,1) + 1;
    index_y = data(n,2) + 1;

    % access the data
    for i = 1:var_num
        var(index_x,index_y,i) = data(n,i);
    end
end

fprintf('reshape the data\n');

%% data save to mat
index_str = find( '.' == filename );
if isempty(index_str)
else
    filename = filename( 1:index_str-1 );
end
eval(['save ',filename,'.mat var var_name var_num;']);

fprintf('save the data\n');
end
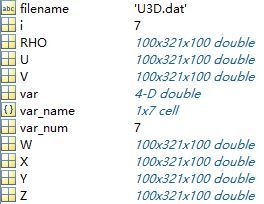
2、测试脚本,读取给定的TECPLOT文件名,输出文件包含数据以及将文件中定义的变量加载到MATLAB工作区
clc;clear;
close all;

filename = 'U3D.dat';
[var,var_name,var_num] = tecplot2mat_3D(filename);

for i = 1:var_num
    eval([var_name{1,i},'=var(:,:,:,i);']);
end
3、测试结果,tecplot文件定义的变量就全部加载到工作区了。
![]()
