R语言中的svm实例
svm
WANGChang
2016年2月18日
n=150
p=2
sigma = 1
meanpos = 0
meanneg =3
npos = round(n/2)
nneg = n-npos
##生成数据中正负实例样本特征值
xpos = matrix(rnorm(npos*p,mean =meanpos,sd = sigma),npos,p)
xneg = matrix(rnorm(nneg*p,mean =meanneg,sd = sigma),npos,p)
x = rbind(xpos,xneg)
##生成类别标签
y = matrix(c(rep(1,time =npos),rep(-1,nneg)))
##rep()函数指的是后面重复前面次数
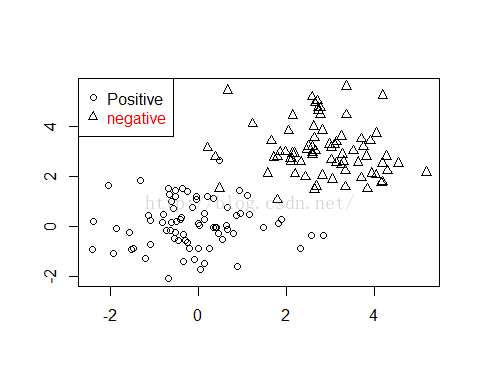
##观察数据发现数据线性可分
plot(x,pch = ifelse(y>0,1,2),xlab = "",ylab = "")
legend("topleft",c('Positive','negative'),pch = seq(2),text.col = seq(2))
##pch为点的形状类别,text.col指颜色类别
###在数据集中随机选取80%的数据作为学习样本,剩余20%的作为预测样本
ntrain <- round(n*0.8)
tindex <- sample(n,ntrain)
xtrain <- x[tindex,]
xtest <- x[-tindex,]
ytrain <- y[tindex]
ytest <- y[-tindex]
istrain <- rep(0 ,n)
istrain[tindex] = 1
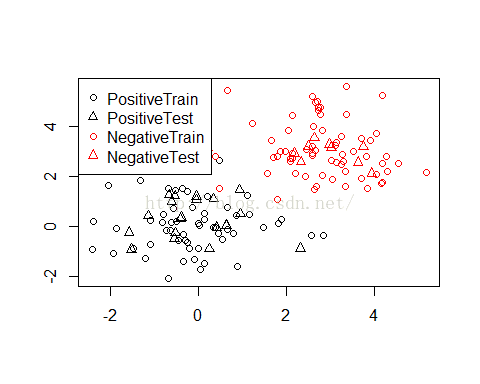
#观察学习样本与预测样本的特征值与类别情况
plot(x,col = ifelse(y>0,1,2),pch = ifelse(istrain==1,1,2),xlab = "",ylab ="")
legend("topleft",c('PositiveTrain','PositiveTest','NegativeTrain','NegativeTest'),
pch = c(1,2,1,2), col = c(1,1,2,2))
#载入程序包,利用ksvm函数对样本数据进行学习
library(kernlab)
## Warning: package 'kernlab'was built under R version 3.2.3
svp <- ksvm(xtrain,ytrain,type = "C-svc",kernel = 'vanilladot',C = 100,scaled= c())
## Setting default kernel parameters
##观察学习后的svm模型
svp
## Support Vector Machineobject of class "ksvm"
##
## SV type: C-svc (classification)
## parameter : cost C = 100
##
## Linear (vanilla) kernel function.
##
## Number of Support Vectors : 7
##
## Objective Function Value : -507.8632
## Training error : 0.025
##详细观察模型各属性
##attributes(svp)
##观察学习样本中的支持向量样本
alpha(svp)
## [[1]]
## [1] 100.000000 5.543819 100.000000 48.882801 100.000000 100.000000
## [7] 54.426620
alphaindex(svp)
## [[1]]
## [1] 10 40 48 51 57 71 81
b(svp)
## [1] -2.682805
plot(svp,data =xtrain)
#可视化模型结果,颜色表示样本分类的确信度(集合间隔),加粗的样本点为支持向量
##使用学习后的模型进行预测
ypred = predict(svp,xtest)
table(ytest,ypred)
## ypred
## ytest -1 1
## -110 0
## 1 0 20
##计算结果的准确率
sum(ypred== ytest)/length(ytest)
## [1] 1
##计算分类函数值f(x)即:W(T)x+b
ypredscore = predict(svp,xtest,type="decision")
##载入ROCR包,用于刻画ROC曲线,计算预测结果分类的各项指标
library(ROCR)
## Warning: package 'ROCR'was built under R version 3.2.3
## Loading required package:gplots
## Warning: package 'gplots'was built under R version 3.2.3
##
## Attaching package: 'gplots'
##
## The following object is masked from'package:stats':
##
## lowess
pred <- prediction(ypredscore,ytest)
#刻画ROC曲线
perf <- performance(pred,measure = "tpr",x.measure = "fpr")
plot(perf)
#刻画查全率和查准率
perf <- performance(pred,measure = "prec",x.measure = "rec")
plot(perf)


