Tensorflow2.0使用卷积神经网络CNN预测fashion_mnist数据集解决图像分类问题
Tensorflow2.0使用CNN预测fashion_mnist数据集解决图像分类问题
- 1、数据导入
- 2、卷积神经网络CNN
- 2.1、卷积神经网络CNN结构搭建
- 2.2、编译训练
- 2.2.1、CNN编译训练
- 2.2.2、metrics介绍
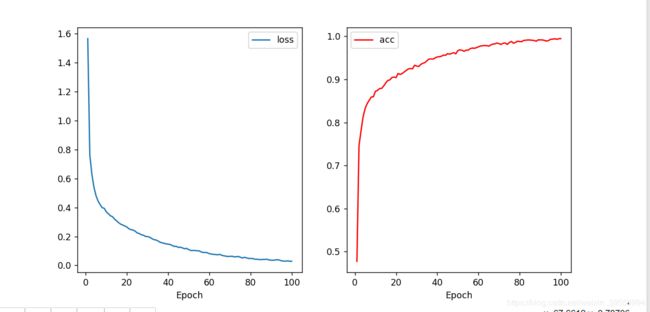
- 2.3、绘制损失函数和准确率图像
- 3、在测试集上进行模型评价
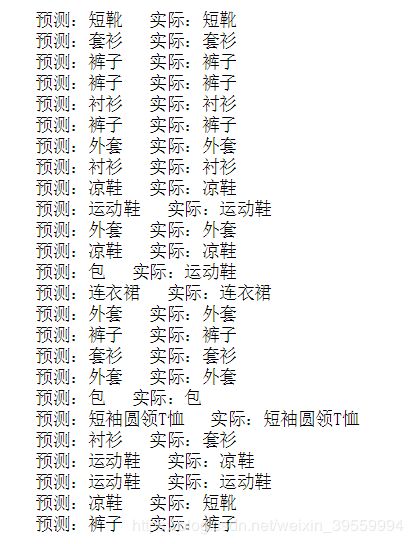
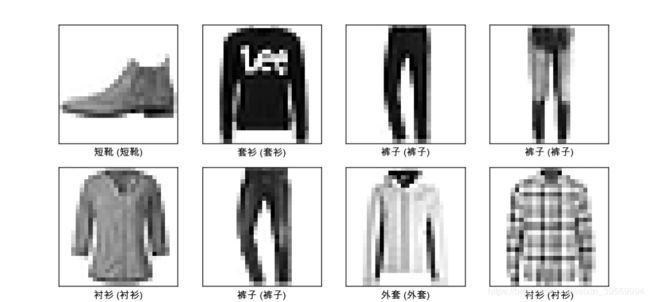
- 4、模型预测效果展示
1、数据导入
import pandas as pd
import tensorflow as tf
import numpy as np
import matplotlib.pyplot as plt
%matplotlib notebook

(train_features,train_labels),(test_features,test_labels)=tf.keras.datasets.fashion_mnist.load_data()
train_features = train_features/255
test_features = test_features/255
print("训练集个数与照片尺寸 {}".format(train_features.shape))
print("测试集个数与照片尺寸 {}".format(test_features.shape))
print("第一张照片的分类 {}".format(train_labels[0]))
train_features[0]

由此可知训练集有60000张照片,测试集有10000张照片,并且照片大小是28*28,一个通道。照片的描述是由RGB描述的,使用RGB模型为图像中每一个像素的RGB分量分配一个0~255范围内的强度值。通过使用不同强度的三原色,红、绿、蓝色的光线来组合成不同的色彩。所以照片中的每一个像素值的范围是0到255,所以照片每一个像素值除以255就可以把范围压缩到0到1之间,从而达到归一化的目的。
关于RGB三原色定义照片可参见https://zhidao.baidu.com/question/314696791.html
2、卷积神经网络CNN
2.1、卷积神经网络CNN结构搭建
model = tf.keras.Sequential([
    tf.keras.Input(shape=(28,28)),
    tf.keras.layers.Reshape([28,28,1]),
    tf.keras.layers.Conv2D(filters=64 ,kernel_size=3 , padding='same', activation='relu'),
    tf.keras.layers.Conv2D(filters=16 ,kernel_size=3 , padding='same', activation='relu'),
    tf.keras.layers.Flatten(),
    tf.keras.layers.Dense(10, activation='softmax')
])
model.summary()
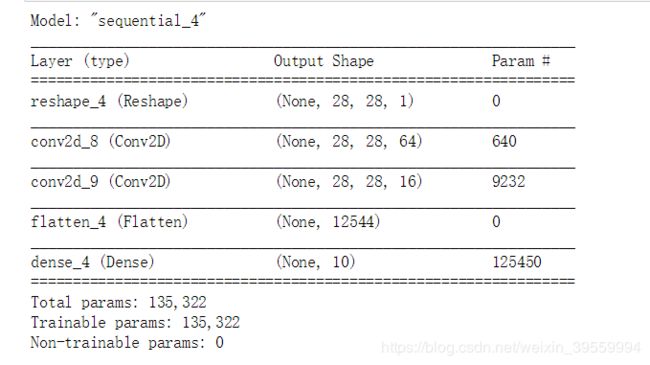
模型结构为:

其中(None,N,N,K)第一个None取决于训练集的大小所以是未知的,第二个N和第三个N代表的是卷积核大小是N*N,最后一个k代表的是卷积核数目,也就是输出获取的特征的数目。
2.2、编译训练
2.2.1、CNN编译训练
"""模型编译"""
model.compile(
    optimizer = 'adam',
    loss = 'sparse_categorical_crossentropy',
    metrics = ['acc']
)

"""模型训练"""
# train_features = train_features[0:10000]  #取钱
# train_labels = train_labels[0:10000]
history = model.fit(x_train, x_label, epochs = 10, batch_size=1000)
history
语法结构:model.compile(loss=‘目标损失函数’, optimizer=optimizer, metrics=['性能评估‘])
目标损失函数:mse、mae、mape、msle、squared_hinge、hinge、binary_crossentropy、categorical_crossentrop、sparse_categorical_crossentrop等
2.2.2、metrics介绍
上文中提到model.compile(loss=‘目标损失函数’, optimizer=optimizer, metrics=['性能评估‘]),有一个性能评估函数metrics=['性能评估‘]),在代码中我们所采用的是准确率acc,其实python还内置很多性能评估函数,最后我们在介绍有哪些内置的评估函数。
2.3、绘制损失函数和准确率图像
hist = pd.DataFrame(history.history)
hist['epoch'] = history.epoch
hist['epoch']=hist['epoch']+1

def plot_history(hist):
    plt.figure(figsize=(10,5))
    plt.subplot(1,2,1)
    plt.xlabel('Epoch')
    plt.plot(hist['epoch'], hist['loss'],
           label='loss')
    plt.legend()
    plt.subplot(1,2,2)
    plt.xlabel('Epoch')
    plt.plot(hist['epoch'], hist['acc'],
           label = 'acc',color = 'red')
#     plt.ylim([0,30])
    plt.legend()
#     plt.show()
plot_history(hist)
3、在测试集上进行模型评价
"""模型评价"""
model.evaluate(test_features, test_labels, verbose=2)
4、模型预测效果展示
prediction = model.predict(test_features)
class_names = ['短袖圆领T恤', '裤子', '套衫', '连衣裙', '外套',
              '凉鞋', '衬衫', '运动鞋','包', '短靴']
for i in range(25):
    pre = class_names[np.argmax(prediction[i])]
    tar = class_names[test_labels[i]]
    print("预测:%s   实际:%s" % (pre, tar))
plt.rcParams['font.sans-serif']=['Arial Unicode MS']            #显示中文字体,这段代码我可是找了好长时间
plt.rcParams['axes.unicode_minus']=False

# 保存画布的图形,宽度为 10 , 长度为10
plt.figure(figsize=(10,10))

# 预测 25 张图像是否准确,不准确为红色。准确为蓝色
for i in range(16):
    # 创建分布 5 * 5 个图形
    plt.subplot(4, 4, i+1)
    plt.xticks([])
    plt.yticks([])
    plt.grid(False)
    # 显示照片,以cm 为单位。
    plt.imshow(test_features[i], cmap=plt.cm.binary)

    # 预测的图片是否正确,黑色底表示预测正确,红色底表示预测失败
    predicted_label = np.argmax(prediction[i])
    true_label = test_labels[i]
    if predicted_label == true_label:
        color = 'black'
    else:
        color = 'red'
    plt.xlabel("{} ({})".format(class_names[predicted_label],
                                class_names[true_label]),
                                color=color)
def plot_image(i, predictions_array, true_labels, images):
    predictions_array, true_label, img = predictions_array[i], true_labels[i], images[i]
    plt.grid(False)
    plt.xticks([])
    plt.yticks([])
    plt.grid(False)
    # 显示照片,以cm 为单位。
    plt.imshow(images[i], cmap=plt.cm.binary)

    # 预测的图片是否正确,黑色底表示预测正确,红色底表示预测失败
    predicted_label = np.argmax(prediction[i])
    true_label = test_labels[i]
    if predicted_label == true_label:
        color = 'black'
    else:
        color = 'red'
#     plt.xlabel("{} ({})".format(class_names[predicted_label],
#                                 class_names[true_label]),
#                                 color=color)
    plt.xlabel("预测{:2.0f}%是{}(实际{})".format(100*np.max(predictions_array),
                                class_names[predicted_label],
                                class_names[true_label]),
                                color=color)


def plot_value_array(i, predictions_array, true_label):
    predictions_array, true_label = predictions_array[i], true_label[i]
    plt.grid(False)
    plt.xticks(range(10))
    plt.yticks([])
    thisplot = plt.bar(range(10), predictions_array, color="#777777")
    plt.ylim([0, 1])
    predicted_label = np.argmax(predictions_array)

    thisplot[predicted_label].set_color('red')
    thisplot[true_label].set_color('blue')

num_rows = 5
num_cols = 3
num_images = num_rows*num_cols
plt.figure(figsize=(2*2*num_cols, 2*num_rows))
for i in range(num_images):
    plt.subplot(num_rows, 2*num_cols, 2*i+1)
    plot_image(i, prediction, test_labels, test_features)
    plt.subplot(num_rows, 2*num_cols, 2*i+2)
    plot_value_array(i, prediction, test_labels)
参考文献:https://blog.csdn.net/weixin_43943977/article/details/103370271?utm_medium=distribute.pc_relevant.none-task-blog-OPENSEARCH-2&depth_1-utm_source=distribute.pc_relevant.none-task-blog-OPENSEARCH-2


