OpenCV图像操作的实际应用
OpenCV图像操作的实际应用
一. 提取目标区域
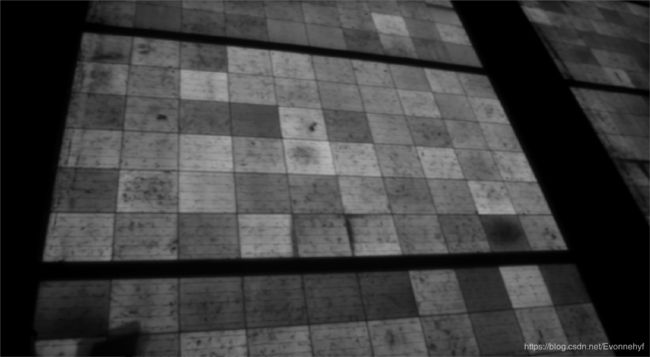
1.1 下采样 + 均值滤波
- 下采样:使用高斯核做卷积,再删除偶数行和列,图像成比例缩小。
- 均值滤波: 取周围像素点的均值,代替该像素点
# 读入数据
path = r'./DSC_6587.JPG'
origin = cv2.imread(path, 1)

# 图像下采样 + 均值滤波:加快图像处理速度,模糊内部边缘
origin1 = cv2.pyrDown(origin)
origin2 = cv2.pyrDown(origin1)

blur_data = cv2.blur(origin2, (5,5))
cv2.namedWindow('pre_edge', cv2.WINDOW_NORMAL)
cv2.imshow('pre_edge', blur_data)
cv2.waitKey(0)
cv2.destroyAllWindows()
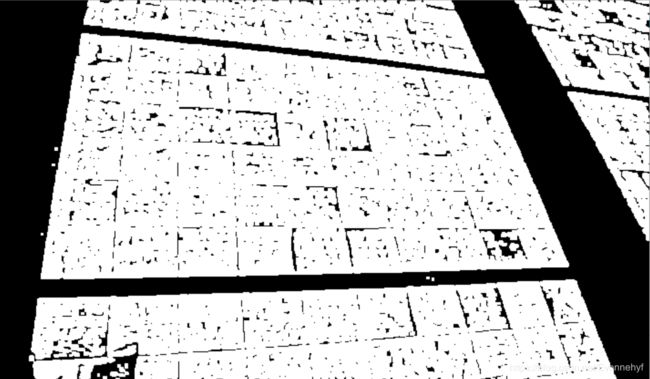
1.2 灰度处理 + 二值化 + 形态学转换
- 自适应二值化:参数含义可见我的“分水岭”博客
- 膨胀:相当于最大池
- 腐蚀:相当于最小池
- 开运算
- 先腐蚀再膨胀:去除小的明亮区域,并且剩余的明亮区域被隔绝
gray = cv2.cvtColor(blur_data, cv2.COLOR_BGR2GRAY)
binary = cv2.adaptiveThreshold(gray, 255, cv2.ADAPTIVE_THRESH_MEAN_C, cv2.THRESH_BINARY, 21, 0)

# 膨胀三次,核大小为 3*3
kernel = cv2.getStructuringElement(cv2.MORPH_RECT, (3,3))
binary = cv2.dilate(binary, kernel, iterations = 3)

# 开操作
kernel = cv2.getStructuringElement(cv2.MORPH_RECT, (5,5))
opening = cv2.morphologyEx(binary, cv2.MORPH_OPEN, kernel, 3)
cv2.namedWindow('opening', cv2.WINDOW_NORMAL)
cv2.imshow('opening', opening)
cv2.waitKey(0)
cv2.destroyAllWindows()
1.3 寻找最大轮廓
- cv2.findContours
- 求轮廓长度:cv2.arcLength(contours[i])
- 求轮廓面积:cv2.contourArea(contours[i])
- cv2.fillPoly:填充任意形状的图型
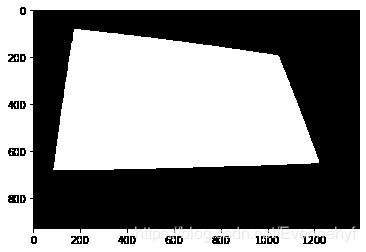
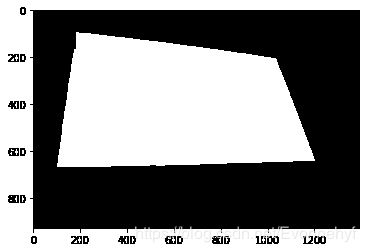
_, contours, hierarchy = cv2.findContours(opening, cv2.RETR_TREE, cv2.CHAIN_APPROX_SIMPLE)

contours = sorted(contours, key = cv2.contourArea, reverse = True)
contour = contours[0]
background = np.zeros(opening.shape, np.uint8)

# 根据轮廓线信息,获取目标区域

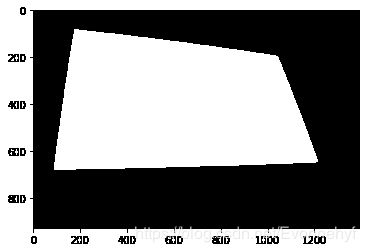
target_area = cv2.fillPoly(background, [contour], (255,255,255))
plt.imshow(background, cmap = plt.cm.gray)
1.4 分水岭算法
-
原理介绍:
-
基本思想是把图像看作是测地学上的拓扑地貌,图像中每一点像素的灰度值表示该点的海拔高度,每一个局部极小值及其影响区域称为集水盆,而集水盆的边界则形成分水岭。分水岭的概念和形成可以通过模拟浸入过程来说明。在每一个局部极小值表面,刺穿一个小孔,然后把整个模型慢慢浸入水中,随着浸入的加深,每一个局部极小值的影响域慢慢向外扩展,在两个集水盆汇合处构筑大坝,即形成分水岭。
-
分水岭算法对微弱边缘具有良好的响应,图像中的噪声、物体表面细微的灰度变化,都会产生过度分割的现象。但同时由于对微弱边缘的良好响应,是得到封闭连续边缘的保证。
-
OpenCV实现了一个基于标记mark的分水岭算法,提前指定哪些是要合并的点,哪些不是。所以我们要做的是给不同的标签,给知道是目标的区域加上一个标签,非目标区域加上另一个标签,最后不知道是什么的区域标记为0。
-
-
cv2.watershed(三通道图像, 种子)
-
关于种子的制作
- 前景:待提取区域的子集
- 背景:待提取区域是背景子集
- 未知区域:背景 - 前景 = 边缘位置所在区域
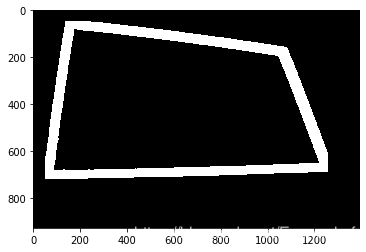
# 通过膨胀获取背景区域
kernel = cv2.getStructuringElement(cv2.MORPH_RECT, (25, 25))
sure_bg = cv2.dilate(target_area, kernel, iterations = 3)
plt.imshow(sure_bg, cmap = plt.cm.gray)
# 通过腐蚀获取背景区域
sure_fg = cv2.erode(target_area, kernel, 10)
plt.imshow(sure_fg, cmap = plt.cm.gray)
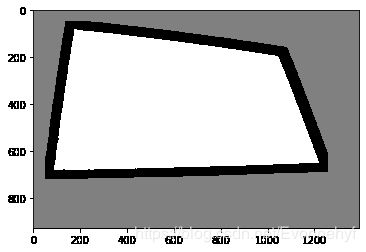
# 获取未知区域
surface_fg = np.uint8(sure_fg)
unknown = cv2.subtract(sure_bg, surface_fg)
plt.imshow(unknown, cmap = plt.cm.gray)
#制作种子
ret, markers = cv2.connectedComponents(surface_fg)
markers = markers + 1
markers[unknown == 255] = 0
plt.imshow(markers, cmap = plt.cm.gray)
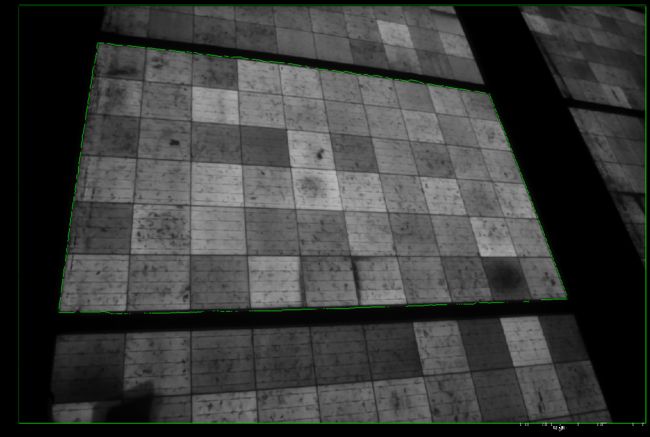
# 展示分水岭算法找到的边缘
markers = cv2.watershed(origin2, markers = markers) # 获取"水坝线"
origin2[markers == -1] = [0, 255, 0]
figure = plt.figure(figsize = (20, 20))
plt.imshow(origin2[:, :, [2, 1, 0]])
二. 目标区域透视变换
2.1 凸包优化边缘
# 提取边缘信息
markers1 = markers[1: markers.shape[0]-1, 1: markers.shape[1]-1]
[x, y] = np.where(markers1 == -1)
location = []
for i,j in zip(x,y):
    location.append([i,j])
location = np.array(location)

# 做一个凸包平滑分水岭边缘
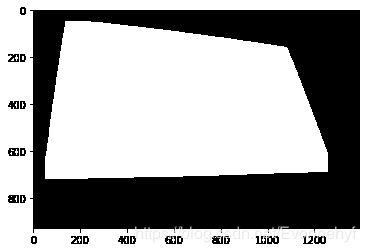
hull = cv2.convexHull(location, returnPoints = True)

# 展示目标区域
hull = hull[:,:,[1,0]]
hull.shape
background = np.zeros(opening.shape, np.uint8)
target_area2 = cv2.fillPoly(background, [hull], (255,255,255))
plt.imshow(background, cmap = plt.cm.gray)
2.2 确定四角坐标
- 需要根据凸包上的点信息,确定目标区域的四个边角坐标,而后采用透视变换
# 根据两点之间的距离,距离最远的两点,即为四边形某一条对角线上的两个顶点
hull_df, dist, point = pd.DataFrame(hull.reshape(-1,2)),[],[]
for index, row in hull_df.iterrows():
    dist.append(hull_df.T.apply(lambda x: np.sqrt(np.sum(np.square(x - row)))))

dist = np.array(dist)
x,y = np.where(dist == dist.max())
point1 = hull[x[0]][0]
point2 = hull[x[1]][0]
point.append(point1)
point.append(point2)

# 根据点到直线的距离,找到最大值(正)、最小值(负),即为剩余两点
k = (point1[1] - point2[1]) / (point1[0] - point2[0])
b = point1[1] - k * point1[0]
d = []
for i in range(hull.shape[0]):
    d.append(k * hull[i,:,0] - hull[i,:,1] + b)
point.append(hull[np.where(d == max(d))[0]][0][0])
point.append(hull[np.where(d == min(d))[0]][0][0])
point = np.array(point)

# 确定四个点的具体位置
sum = point[:,0] + point[:,1]
rb = point[np.where(sum == sum.max())].reshape(2)
tl = point[np.where(sum == sum.min())].reshape(2)
diff1 = abs(point[:,0] - rb[0])
diff2 = abs(point[:,0] - tl[0])
tr = point[np.where(diff1 == sorted(diff1)[1])].reshape(2)
lb = point[np.where(diff2 == sorted(diff2)[1])].reshape(2)
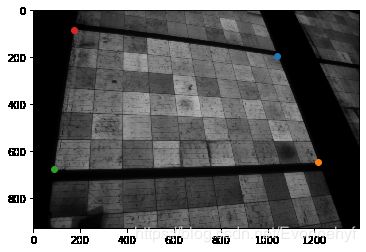
plt.imshow(origin2)
plt.scatter(tr[0],tr[1])
plt.scatter(rb[0],rb[1])
plt.scatter(lb[0],lb[1])
plt.scatter(tl[0],tl[1])
2.3 透视变换
- 二维空间上的平移、缩放等操作,称为仿射变换
- 透视变换,则是三维空间上的非线性变换,可看作是仿射变换的更一般形式,简单讲即通过一个3x3的变换矩阵将原图投影到一个新的视平面(Viewing Plane),在视觉上的直观表现就是产生或消除了远近感。
#确定变换后的图像长宽
length = 5000 // 4
width = 3000 // 4
pts1 = np.float32([tl, lb, tr, rb])
pts2 = np.float32([[0,0],[0,width],[length,0],[length,width]])
# 求解变换矩阵
M = cv2.getPerspectiveTransform(pts1, pts2)
# 根据原图以及矩阵求得变换后的图像
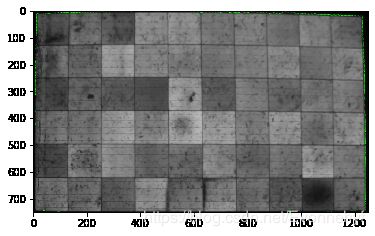
dst = cv2.warpPerspective(origin2, M, (length, width))
plt.imshow(dst)
- 目标区域已经成功提取出来啦
- 欢迎交流:[email protected]

