python实现线性回归梯度下降算法
梯度下降模型
线性回归公式推导查看
梯度下降公式推导查看
伪代码:
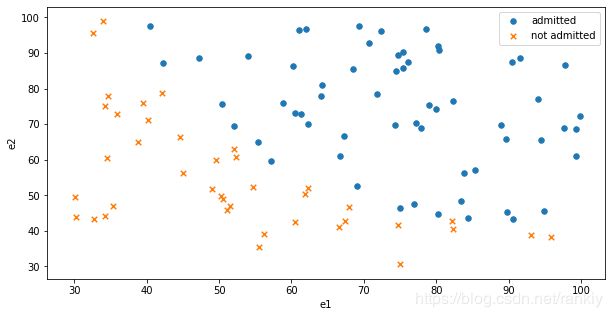
读取数据(查看数据分布)
拆分正负数据集
实现逻辑回归算法
建立分类器
设定阈值,根据阈值完成数据结果
sigmoid:映射到概率的函数
model:返回预测结果值
cost:根据参数计算损失
gradient:计算每个参数的梯度方向
descent:进行参数更新
accuracy:计算精度
优化及比较
梯度下降处理原则
首先优化数据,如归一化处理等
然后优化模型,如更换算法模型,调整参数等
比较三种梯度下降方法
1、迭代次数,限定梯度下降计算次数
2、计算损失值,比较损失值,与目标函数变化很小
3、梯度变化,判断梯度很小时
三种梯度下降法
1、批量梯度下降法BGD:目的是要误差函数尽可能的小
初始化weigths,然后不断反复的更新weights使得误差函数减小,直到满足要求时停止
2、随机梯度下降法SGD:利用每个样本的损失函数对θ求偏导得到对应的梯度,来更新θ
3、min-batch 小批量梯度下降法MBGD:结合批量梯度下降与随机梯度下降
运行效率高,代码收敛快
读取数据、图型化查看数据分布
import numpy as np
import pandas as pd
import matplotlib.pyplot as plt

#读取数据
path='F:\python\机器学习\data\梯度下降求解逻辑回归\梯度下降\data\logireg_data.txt'
data=pd.read_csv(path,header=None,names=['e1','e2','admitted'])

#数据图型化查看
positive=data[data['admitted']==1]
negative=data[data['admitted']==0]
fig,ax=plt.subplots(figsize=(10,5))
ax.scatter(positive['e1'],positive['e2'],s=30,marker='o',label='admitted')
ax.scatter(negative['e1'],negative['e2'],s=30,marker='x',label='not admitted')
ax.legend()
ax.set_xlabel('e1')
ax.set_ylabel('e2')
#原始数据处理
data.insert(0,'ones',1) #增加常量列
theta=np.zeros([1,3])
#数据构造
orig_data=data.values #构造矩阵
cols=orig_data.shape[1]
X=orig_data[:,0:cols-1]
y=orig_data[:,cols-1:cols]
实现逻辑回归算法
目标:建立分类器(求解三个参数)
设定阈值,根据阈值完成数据结果
sigmoid函数,求解 g ( z ) = 1 1 + e − z g(z)=\frac{1}{1+e^{-z}} g(z)=1+e−z1
def sigmoid(z):
    return 1/(1+np.exp(-z))
计算矩阵积
( a 1 b 1 c 1 a 2 b 2 c 2 a 3 b 3 c 3 ⋯ ) ( θ 1 θ 2 θ 3 ) = ( y 1 y 2 y 3 ⋯ ) \begin{pmatrix} a_1 & b_1&c_1 \\ a_2 & b_2&c_2\\ a_3 & b_3&c_3\\&\cdots&\end{pmatrix}\begin{pmatrix}θ_1\\θ_2\\θ_3\end{pmatrix}=\begin{pmatrix}y_1\\y_2\\y_3\\\cdots\end{pmatrix} ⎝⎜⎜⎛a1a2a3b1b2b3⋯c1c2c3⎠⎟⎟⎞⎝⎛θ1θ2θ3⎠⎞=⎝⎜⎜⎛y1y2y3⋯⎠⎟⎟⎞
def model(X,theta):
    return sigmoid(np.dot(X,theta.T))
损失函数: D ( h ( x i ) , y i ) = − y i ∗ l o g ( h ( x i ) ) − ( 1 − y i ) l o g ( 1 − h ( x i ) ) D(h(x_i),y_i)=-y_i*log(h(x_i))-(1-y_i)log(1-h(x_i)) D(h(xi),yi)=−yi∗log(h(xi))−(1−yi)log(1−h(xi))
平均损失: J ( θ ) = − 1 n ∑ k = 1 n D ( h ( x i ) , y i ) J(θ)=-\frac{1}{n} \displaystyle\sum_{k=1}^nD(h(x_i),y_i) J(θ)=−n1k=1∑nD(h(xi),yi)
def cost(X,y,theta):
    left=np.multiply(-y,np.log(model(X,theta)))
    right=np.multiply(1-y,np.log(1-model(X,theta)))
    return np.sum(left-right)/(len(X))
#计算梯度,计算J(θ)的偏导: ∂ J ∂ θ = − 1 m ∑ k = 1 n ( y i − h ( x i ) ) x i \frac{∂J}{∂θ}=-\frac{1}{m} \displaystyle \sum_{k=1}^n (y_i -h(x_i))x_i ∂θ∂J=−m1k=1∑n(yi−h(xi))xi
def gradient(X,y,theta):
    grad=np.zeros(theta.shape)
    error=(model(X,theta)-y).ravel()
    for j in range(len(theta.ravel())):
        term=np.multiply(error,X[:,j])
        grad[0,j]=np.sum(term)/len(X)
    return grad
#比较3种梯度下降方法
stop_iter=0 #叠代次数
stop_cost=1 #损失值,与目标函数变化很小
stop_grad=2 #按梯度变化判断,梯度很小时停止

def stop_criterion(type,value,threshold):
    #设定三种不同的停止策略
    if type==stop_iter: return value>threshold
    elif type==stop_cost: return abs(value[-1]-value[-2])<threshold
    elif type==stop_grad: return np.linalg.norm(value)<threshold
数据打乱,使用np.random.shuffle随机重排
def shuffle_data(data):
    np.random.shuffle(data)
    cols=data.shape[1] #计算列值
    X=data[:,0:cols-1]
    y=data[:,cols-1:]
    return X,y
参数的梯度下降方向
import time
def descent(data,theta,batch_size,stop_type,thresh,alpha):
    init_time=time.time()
    i=0 #迭代次数
    k=0 #batch
    X,y=shuffle_data(data)
    grad=np.zeros(theta.shape) #计算梯度
    costs=[cost(X,y,theta)] #损失函数

    while True:
        grad=gradient(X[k:k+batch_size],y[k:k+batch_size],theta) #计算损失值
        k+=batch_size #取batch数量个数
        if k>=n:
            k=0
            X,y=shuffle_data(data) #重新洗牌
        theta=theta-alpha*grad #参数更新,计算学习率alpha
        costs.append(cost(X,y,theta)) #计算新的损失
        i+=1

        if stop_type==stop_iter: value=i
        elif stop_type==stop_cost: value=costs
        elif stop_type==stop_grad: value=grad
        if stop_criterion(stop_type,value,thresh): break
    return theta,i-1,costs,grad,time.time()-init_time
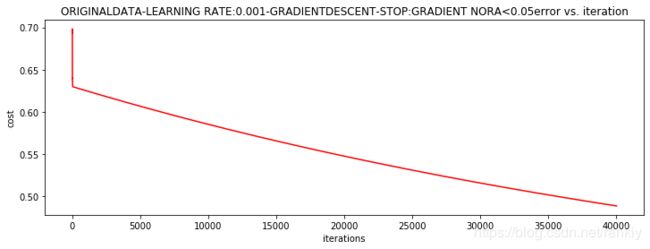
梯度算法的参数指定及打印相关参数,并画梯度变化图型
def run_expe(data,theta,batch_size,stop_type,thresh,alpha):
	theta,iter,costs,grad,dur=descent(data,theta,batch_size,stop_type,thresh,alpha)
    name='original' if(data[:,1]>2).sum()>1 else 'scaled'
    name+='data-learning rate:{}-'.format(alpha)
    if batch_size==n: str_desctype='gradient'
    elif batch_size==1: str_desctype='stochastic'
    else: str_desctype='mini-batch({})'.format(batch_size)
    name += str_desctype + 'descent-stop:'
    if stop_type==stop_iter:str_stop='{} iterations'.format(thresh)
    else: str_stop='gradient nora<{}'.format(thresh)
    name+=str_stop
    print('***{}\ntheta:{}-iter:{}-last cost:{:03.3f}-duration:{:03.2f}s'.format(name,theta,iter,costs[-1],dur))
    fig,ax=plt.subplots(figsize=(12,4))
    ax.plot(np.arange(len(costs)),costs,'r')
    ax.set_xlabel('iterations')
    ax.set_ylabel('cost')
    ax.set_title(name.upper()+'error vs. iteration')
    return theta
选择的梯度下降方法是基于所有样本的
n=100
run_expe(orig_data,theta,n,stop_iter,thresh=50000,alpha=0.001)
结果
theta:[[-2.84950889 0.03070203 0.02275987]]-iter:50000-last cost:0.465-duration:9.57s
run_expe(orig_data,theta,n,stop_cost,thresh=0.000001,alpha=0.001)
theta:[[-5.13364014 0.04771429 0.04072397]]-iter:109901-last cost:0.377-duration:21.15s
run_expe(orig_data,theta,n,stop_grad,thresh=0.05,alpha=0.001)
theta:[[-2.37033409 0.02721692 0.01899456]]-iter:40045-last cost:0.488-duration:7.94s
#不同梯度下降方法对比
for i in np.arange(1,5):
    run_expe(orig_data,theta,i,stop_iter,thresh=5000,alpha=0.0001)
模型损值没有达到预期
数据初始化后梯度下降对比
from sklearn import preprocessing as pp
scaled_data=orig_data.copy()
scaled_data[:,1:3]=pp.scale(orig_data[:,1:3])
d1_mean=orig_data[:,1].mean()
d1_std=orig_data[:,1].std()
d2_mean=orig_data[:,2].mean()
d2_std=orig_data[:,2].std()
run_expe(scaled_data,theta,n,stop_iter,thresh=5000,alpha=0.001)
theta:[[0.3080807 0.86494967 0.77367651]]-iter:5000-last cost:0.383-duration:0.99s
小批量梯度下降
theta=run_expe(scaled_data,theta,16,stop_grad,thresh=0.004,alpha=0.001)
损失值已计算至0.220
theta:[[1.07252195 2.63227939 2.40931402]]-iter:59442-last cost:0.220-duration:5.62s
预测值计算
def predict(X,theta):
    return [1 if x>=0.5 else 0 for x in model(X,theta)]
画出结果图型
import random
def plt_plot(theta,d1_mean,d1_std,d2_mean,d2_std):
    X1=[]
    print(d1_mean,d1_std,d2_mean,d2_std)
    for i in range(100):
        X1.append([(random.randint(30,100)-d1_mean)/d1_std,(random.randint(30,100)-d2_mean)/d2_std])
    X1=pd.DataFrame(X1)
    X1.insert(0,'a',1)
    X1=X1.values
    y=np.array(predict(X1,theta)).reshape(-1,1)
    print('y-sum:',sum(y))
    df1=pd.DataFrame(np.hstack((X1,y)))
    print(df1.head(10))
    p1=df1[df1[3]==1]
    n1=df1[df1[3]==0]

    fig,ax=plt.subplots(figsize=(10,5))
    ax.scatter(p1[1]*d1_std+d1_mean,p1[2]*d2_std+d2_mean,s=30,marker='o',label='new_admitted')
    ax.scatter(n1[1]*d1_std+d1_mean,n1[2]*d2_std+d2_mean,marker='x',label='new_not admitted')
    ax.scatter(positive['e1'],positive['e2'],s=30,marker='o',label='admitted')
    ax.scatter(negative['e1'],negative['e2'],s=30,marker='x',label='not admitted')
    ax.legend()

plt_plot(theta,d1_mean,d1_std,d2_mean,d2_std)
scaled_X=scaled_data[:,:3]
y=scaled_data[:,3]
predictions=predict(scaled_X,theta)
correct=[1 if ((a==1 and b==1) or (a==0 and b==0)) else 0 for (a,b) in zip(predictions,y)]
accuracy=(sum(map(int,correct)) % len(correct))
print('accuracy={}%'.format(accuracy))
计算结果为,accuracy=89%


