一维傅里叶变换------matlab分析
一. 正弦函数分析
matlab代码如下:
Fs = 1000;
T = 1./Fs;
L =1000;
t = (0:L-1)*T;
S0 = 2*cos(2*pi*2*t);
figure(1),plot(t,S0);
S00 = 3*cos(2*pi*4*t);
figure(2),plot(t,S00);
S1 = 2*cos(2*pi*2*t)+2*sin(2*pi*4*t);	%'b'
S2 = 2*cos(2*pi*2*t)+3*sin(2*pi*4*t);	%'r'
S3 = 2*cos(2*pi*2*t)+5*sin(2*pi*4*t);   %'g'
S4 = 4*cos(2*pi*2*t)+5*sin(2*pi*4*t);   %'k'
figure(3);title('original signal');
hold on,
plot(t,S1,'b');
plot(t,S2,'r');
plot(t,S3,'g');
plot(t,S4,'k');
hold off;

S1 = 2*cos(2*pi*2*t)+2*cos(2*pi*4*t);	%'b'
S2 = 2*cos(2*pi*2*t)+3*cos(2*pi*4*t);	%'r'
S3 = 2*cos(2*pi*2*t)+5*cos(2*pi*4*t);   %'g'
S4 = 4*cos(2*pi*2*t)+5*cos(2*pi*4*t);   %'k'
figure(4);title('original signal');
hold on,
plot(t,S1,'b');
plot(t,S2,'r');
plot(t,S3,'g');
plot(t,S4,'k');
hold off;
显示的图像如下:
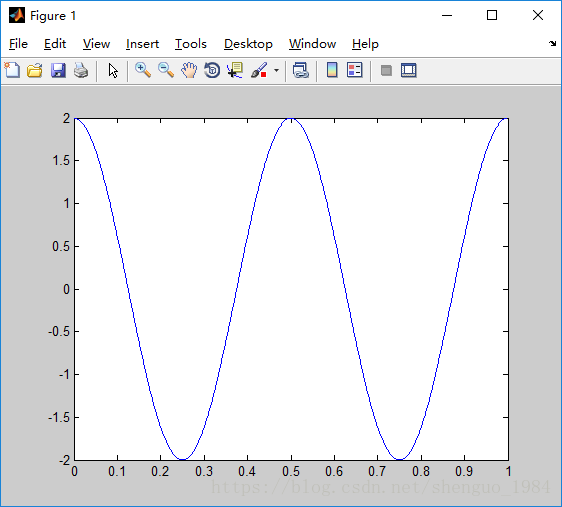
Figure(1), S0的周期为0.5=(2*pi)/(2*pi*2),频率为2Hz,最大幅值为2
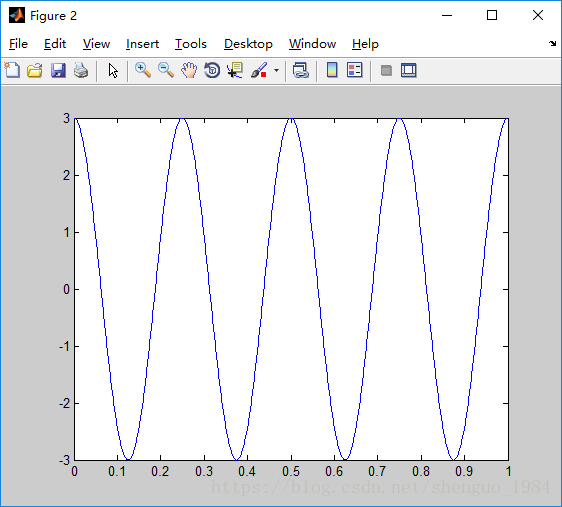
Figure(2), S00的周期为0.25=(2*pi)/(2*pi*4),频率为4Hz,最大幅值为3
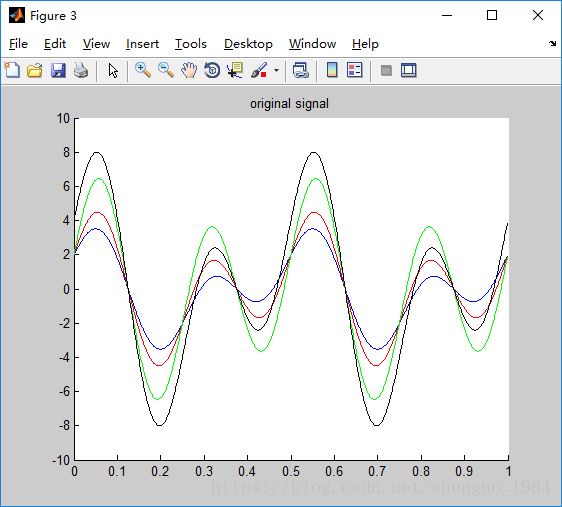
Figure(3), 为一个正弦加上一个余弦函数,周期为0.5和0.25的最小公倍数,为0.5,最大幅值为8
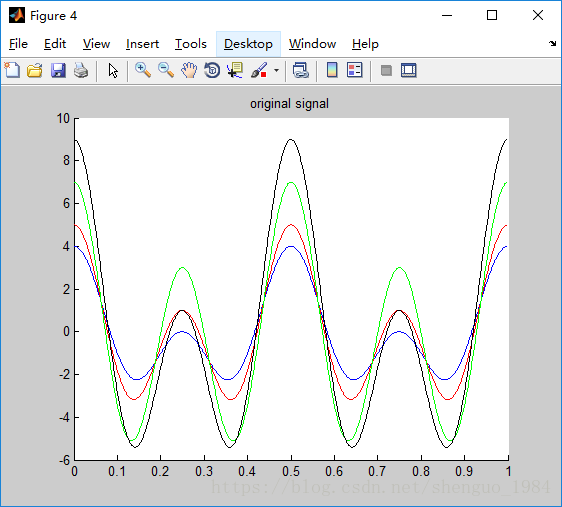
Figure(4), 为两个余弦函数相加,周期为0.5和0.25的最小公倍数,为0.5,最大复制为9
总结:
1. 单一正弦函数,对应的最大幅值为sin函数前面的系数,周期和频率可以根据sin函数内部的定义计算得出。
2. 当周期变小,频率变大,曲线越密集。
3. 多个正弦函数相加,对应的周期为分别各个正弦函数的周期的最大公倍数,最大幅值要根据具体函数转换计算得到
二. 傅里叶变换
clear
clc
% close all

Fs = 1000;
T = 1./Fs;
L =1000;
t = (0:L-1)*T;

S0 = 2*sin(2*pi*20*t);    %standard signal without the noise
figure(1);
plot(t,S0);
title('original signal');
Y1 = fft(S0);                            %fourier transform
figure(2),plot(t,abs(Y1));

S = 2*sin(2*pi*20*t)+3*sin(2*pi*50*t);    %standard signal without the noise
figure(3);
plot(t,S);
title('original signal');
Y1 = fft(S);                            %fourier transform
figure(4),plot(t,abs(Y1));

S1 = 10+2*sin(2*pi*20*t)+3*sin(2*pi*50*t);    %standard signal without the noise
figure(5);
plot(t,S1);
title('original signal');
Y1 = fft(S1);                            %fourier transform
figure(6),plot(t,abs(Y1));
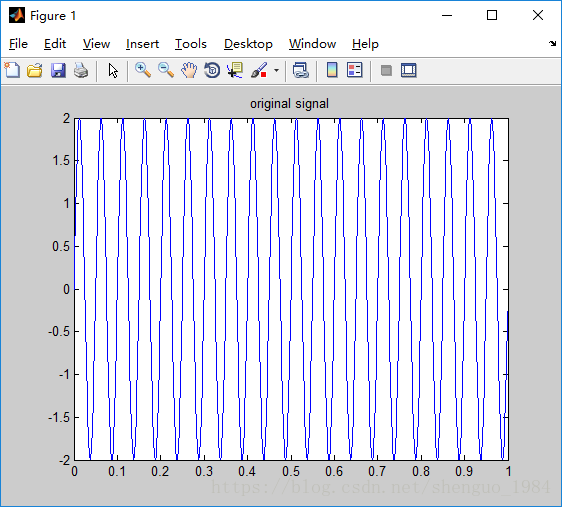
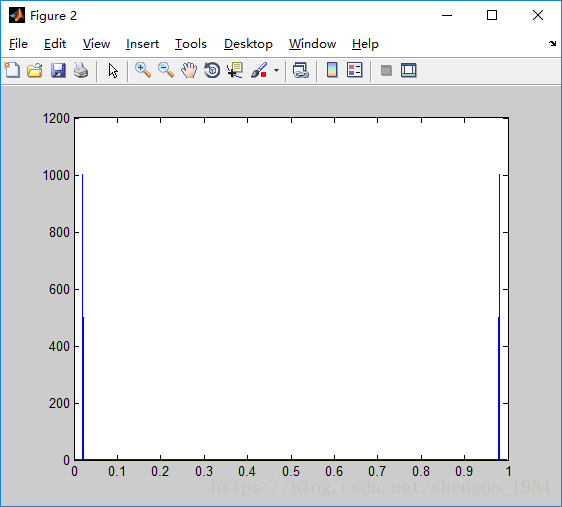
Figure(1),Figure(2):单一正弦曲线和fft曲线;傅里叶曲线峰值为20/1000=0.02Hz(共轭为0.98Hz),其它频率处的傅里叶值几乎为0
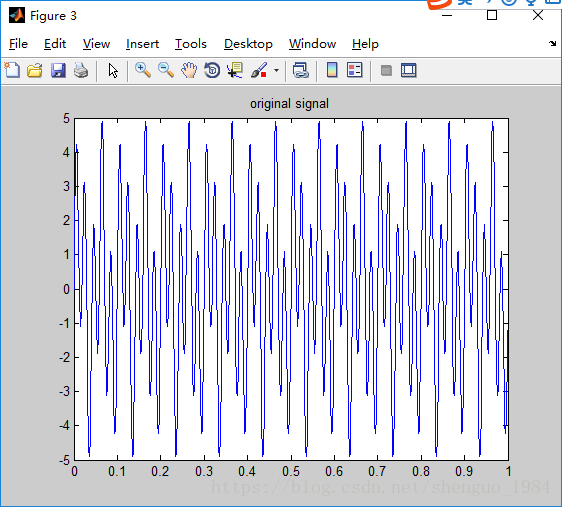
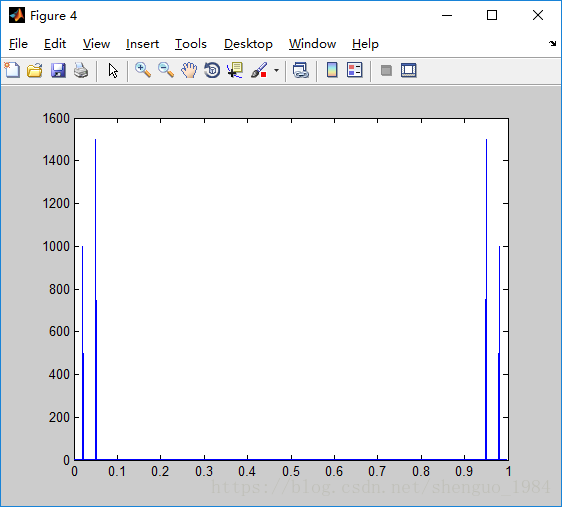
Figure(3),Figure(4):两个正弦曲线相加,以及对应的fft曲线;傅里叶曲线峰值有两个为20/1000=0.02Hz(共轭为0.98Hz),50/1000=0.05Hz(共轭为0.95Hz),其它频率处的幅值几乎为0
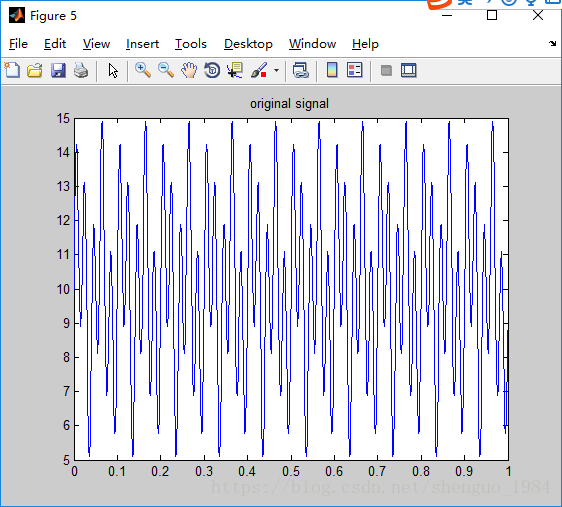
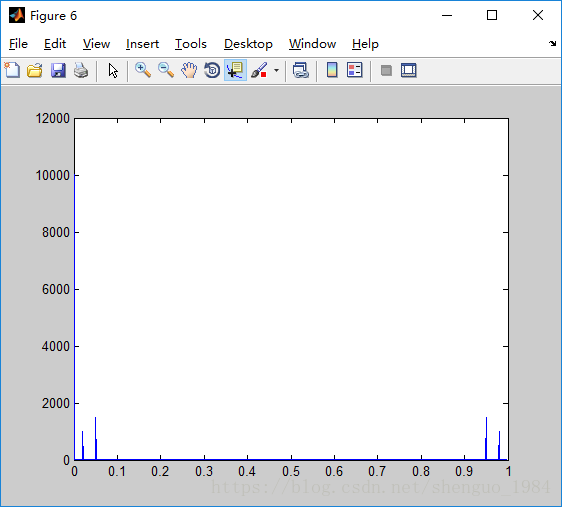
Figure(5),Figure(6):在两个正弦函数的基础上,增加了一个直流分量10;傅里叶曲线的峰值位置不变为20/1000=0.02Hz(共轭为0.98Hz),50/1000=0.05Hz(共轭为0.95Hz),在频率为0处增加了一个10*1000的直流分量线。
总结:
1. 傅里叶变换:将函数分解成直流分量+多个不同频率的正弦函数,然后进行傅里叶变换。
2. 单一正弦的傅里叶曲线,出现峰值的地方为频率所在的地方。
3. 多个正弦相加的傅里叶曲线,出现峰值的位置为两个频率所在的地方。
三. 噪声去噪
clear
clc
% close all

Fs = 1000;
T = 1./Fs;
L =1000;
t = (0:L-1)*T;

S1 = 2*sin(2*pi*2*t)+3*sin(2*pi*4*t);    %standard signal without the noise
X = S1+0.5*randn(size(t));               %signal mixing with noise
figure(1);
plot(t,X);
title('signal mixing with noise');xlabel('time');ylabel('amplitude');
Y = fft(X);                            %fourier transform

threadhold = 10;                        %setting the filtering threadhold
Y1 = Y;
Y1(threadhold:(L-threadhold)) = 0;      %filtering
X1 = ifft(Y1);                          %Inverse Fourier transform
figure(2);
plot(t,X1);
title('signal after filtering');xlabel('time');ylabel('amplitude');

threadhold = 50;                        %setting the filtering threadhold
Y2 = Y;
Y2(threadhold:(L-threadhold)) = 0;      %filtering
X2 = ifft(Y2);                          %Inverse Fourier transform
figure(3);
plot(t,X2);
title('signal after filtering');xlabel('time');ylabel('amplitude');
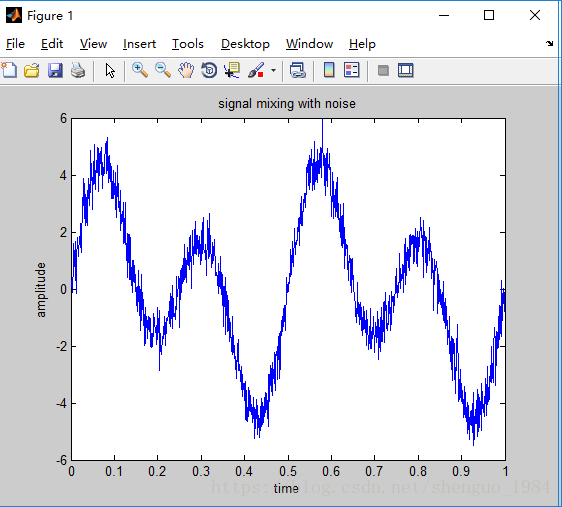
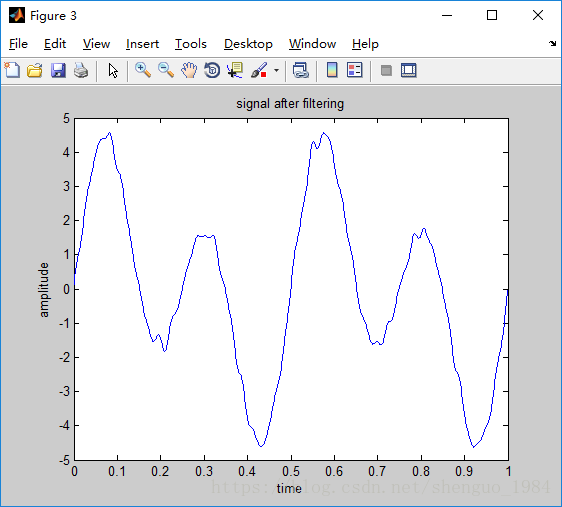
输出如下:
总结:
通过傅里叶变换去除随机噪音,可以去除,但需要选择阈值不同,滤波效果不同
