kaggle经典比赛总结(一)Stacked Regressions to predict House Prices
kaggle经典比赛优秀社区总结:Stacked Regressions to predict House Prices
本文主要讲述特征工程和Stacking回归模型,可以说本文是新手入kaggle必经历的过程。本篇文章主要讲述上如何在数据集上进行特征工程,然后使用sklearn的基础模型加上xgboost和lightGBM进行集成,目的是能够使得线性模型有很好鲁棒性,最终达到一个很好的预测效果。
Stacked Regressions to predict House Prices
kaggle地址:https://www.kaggle.com/serigne/stacked-regressions-top-4-on-leaderboard/comments
这里面首先给几个链接,全都是kaggle社区里面比较好的笔记:
(1)Comprehensive data exploration with Python by Pedro MKarcelino:有关数据分析
(2)A Study on Regression applied to the Ames dataset by Julien Cohen-Solal:在线性回归模型使用特征工程和深度挖掘
(3)Regularized Linear Models by Alexandru Papiu:使用了模型选择和交叉验证
特征工程一般要做的事情:
(1)处理缺失值
(2)转换数据
(3)标签编码
(4)Box Cox 变换
(5)类别特征one-hot编码
一、数据概览
import numpy as np
import pandas as pd
import matplotlib.pyplot as plt
import seaborn as sns

from scipy import stats
from scipy.stats import norm, skew

# set float format limiting floats output to 3 points
pd.set_option('display.float_format', lambda x: '{:.3f}'.format(x))

train = pd.read_csv('/Users/xudong/kaggleData/houseprice/train.csv')
test = pd.read_csv('/Users/xudong/kaggleData/houseprice/test.csv')

# display the first rows of the data
print(train.head(5))
print('------------')
print(test.head(5))

# check the numbers of samples and features
print("The train data size before dropping Id feature is : {} ".format(train.shape))
print("The test data size before dropping Id feature is : {} ".format(test.shape))

# save the 'Id' column
train_ID = train['Id']
test_ID = test['Id']

# Now drop the  'Id' column since it's unnecessary for  the prediction process.
train.drop("Id", axis=1, inplace=True)
test.drop("Id", axis=1, inplace=True)

# check again the data size after dropping the 'Id' variable
print("\nThe train data size after dropping Id feature is : {} ".format(train.shape))
print("The test data size after dropping Id feature is : {} ".format(test.shape))
二、数据处理
1.离群点
数据集文档表明了数据中有离群点(原文地址已经失效,这里就不复制地址立刻),并且建议移除。下面使用plot画出数据特征GrLivArea和SalePrice的数据分布图
# Data Processing 数据处理过程
# outliers 离群点

fig, ax = plt.subplots()
ax.scatter(x=train['GrLivArea'], y=train['SalePrice'])
plt.ylabel('SalePrice', fontsize=13)
plt.xlabel('GrLivArea', fontsize=13)
plt.show()
从图上看,右下角有两个离群点,它们GrLiveArea很大但是SalePrice很小,极度偏离数据,需要删除
# delete outliers
train = train.drop(train[(train['GrLivArea'] > 4000) & (train['SalePrice'] < 300000)].index)
Note:
移除离群点,一般都是选择明显的(比如本文中的超大的面积和很低的价格)
虽然数据中还可能有其他的离群点,但是,把他们都移除了可能会影响到我们的模型的训练如果测试数据中会有离群点的话。所以,一般不会把所有的离群点都移除掉,我们只是增加模型的鲁棒性。
2.目标变量(Target Variable)
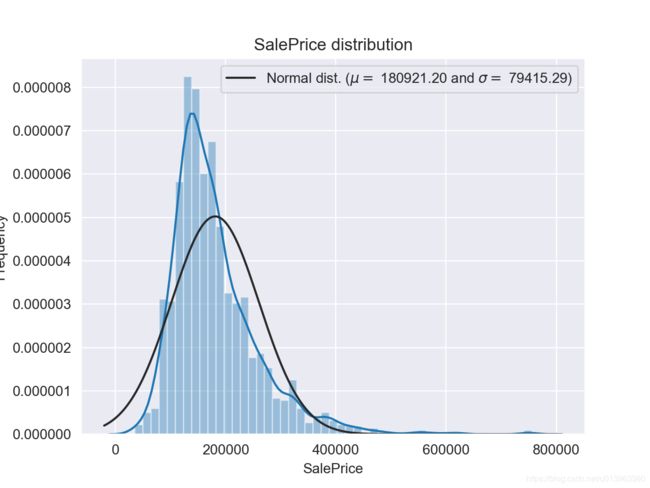
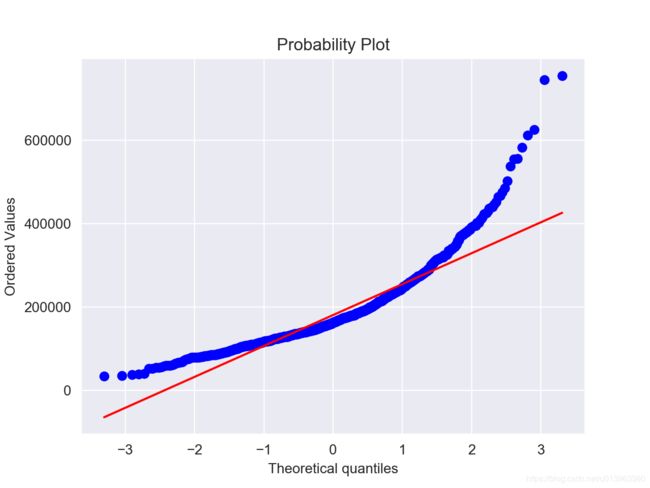
SalePrice是我们需要预测的,因此对这个变量做一些分析。我们一般都期望数据的分布符合正态,但是有时候实际得到的数据不是这样的。
color = sns.color_palette()
sns.set_style('darkgrid')

sns.distplot(train['SalePrice'], fit=norm)

# get the fitted parameters used by the function
(mu, sigma) = norm.fit(train['SalePrice'])
print('\n mu = {:.2f} and sigma = {:.2f}\n'.format(mu, sigma))

# now plot the distribution
plt.legend(['Normal dist. ($\mu=$ {:.2f} and $\sigma=$ {:.2f})'.format(mu, sigma)], loc='best')
plt.ylabel('Frequency')
plt.title('SalePrice distribution')

# get also the QQ-plot
fig = plt.figure()
res = stats.probplot(train['SalePrice'], plot=plt)
plt.show()
SalePrice的分布图:
SalePrice的QQ图:
可以看出的是,目标变量(SalePrice)偏度很大(一般线性模型要求变量的分布符合正态分布)。因此,我们对目标变量进行log变换,变换后重新进行画图(这个地方不贴图了),可以明显看出目标变量的分布比较正常。
# we use the numpy function log1p which applies log(1+x) to all elements of the column
train['SalePrice'] = np.log1p(train['SalePrice'])
3.特征工程
这里将训练数据集和测试数据集拼接起来一起处理
# concat the train and test in the same dataframe
n_train = train.shape[0]
n_test = test.shape[0]
y_train = train.SalePrice.values
all_data = pd.concat((train, test), sort=False).reset_index(drop=True)
all_data.drop(['SalePrice'], axis=1, inplace=True)
print('all_data size is : {}'.format(all_data.shape))
3.1 缺失数据
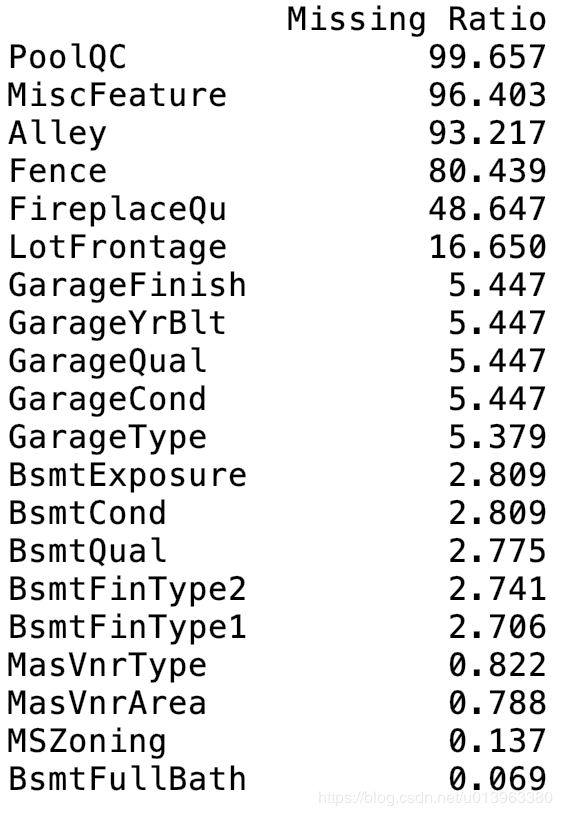
查看数据的特征缺失值的比例
# missing data
all_data_na = (all_data.isnull().sum() / len(all_data))*100
all_data_na = all_data_na.drop(all_data_na[all_data_na == 0].index).sort_values(ascending=False)[:30]
missing_data = pd.DataFrame({'Missing Ratio' : all_data_na})
print(missing_data.head(20))
打印查看缺失比例最大的前20个特征,如下面
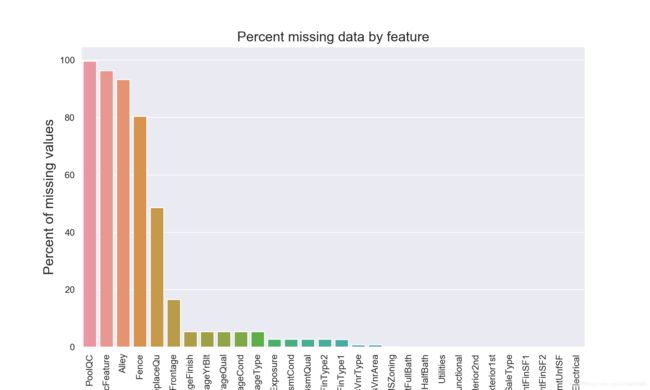
并将缺失数据画成柱状图,如下
# plot the missing data
f, ax = plt.subplots(figsize=(15, 12))
plt.xticks(rotation='90')
sns.barplot(x=all_data_na.index, y=all_data_na)
plt.xlabel('Features', fontsize=15)
plt.ylabel('Percent of missing values', fontsize=15)
plt.title('Percent missing data by feature', fontsize=15)
plt.show()
3.2 特征之间的相关性
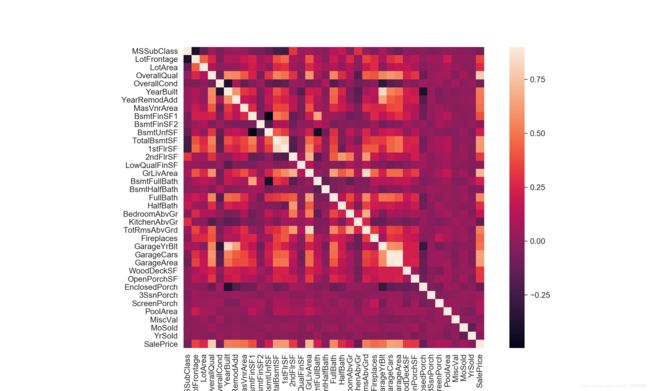
下面计算特征之间的相关性,并画出热力图分布
# data correlation
# correlation map to see how features are correlated with SalePrice
corrmat = train.corr()
plt.subplots(figsize=(12, 9))
sns.heatmap(corrmat, vmax=0.9, square=True)
plt.show()
3.3 处理缺失数据
下面根据数据的对特征字段的描述来处理缺失的数据
# imputing missing values
# we impute them by processding sequentially through features with missing values

# poolQC: data says NA means no pool
all_data['PoolQC'] = all_data['PoolQC'].fillna('None')

# MiscFeature: NA means no misc feature
all_data['MiscFeature'] = all_data['MiscFeature'].fillna('None')

# Alley: NA means no alley access
all_data['Alley'] = all_data['Alley'].fillna('None')

# Fence: NA means no fence
all_data['Fence'] = all_data['Fence'].fillna('None')

# FireplaceQu: NA means no fireplace
all_data['FireplaceQu'] = all_data['FireplaceQu'].fillna('None')

# LotFrontage: have similar area to other houses
# we fill in missing values by median values
all_data['LotFrontage'] = all_data.groupby('Neighborhood')['LotFrontage'].transform(lambda x: x.fillna(x.median()))

# GarageType, GarageFinish, GarageQual and GarageCond : Replacing missing data with None
for col in ('GarageType', 'GarageFinish', 'GarageQual', 'GarageCond'):
    all_data[col] = all_data[col].fillna('None')

# GarageYrBlt, GarageArea and GarageCars : Replacing missing data with 0 (Since No garage = no cars in such garage.)
for col in ('GarageYrBlt', 'GarageArea', 'GarageCars'):
    all_data[col] = all_data[col].fillna(0)

# BsmtFinSF1, BsmtFinSF2, BsmtUnfSF, TotalBsmtSF, BsmtFullBath and BsmtHalfBath : missing values are likely zero for having no basement
for col in ('BsmtFinSF1', 'BsmtFinSF2', 'BsmtUnfSF', 'TotalBsmtSF', 'BsmtFullBath', 'BsmtHalfBath'):
    all_data[col] = all_data[col].fillna(0)

# BsmtQual, BsmtCond, BsmtExposure, BsmtFinType1 and BsmtFinType2 : For all these categorical basement-related features, NaN means that there is no basement.
for col in ('BsmtQual', 'BsmtCond', 'BsmtExposure', 'BsmtFinType1', 'BsmtFinType2'):
    all_data[col] = all_data[col].fillna('None')

# MasVnrArea and MasVnrType : NA most likely means no masonry veneer for these houses. We can fill 0 for the area and None for the type.
all_data['MasVnrArea'] = all_data['MasVnrArea'].fillna(0)
all_data['MasVnrType'] = all_data['MasVnrType'].fillna('None')

# MSZoning (The general zoning classification) : 'RL' is by far the most common value. So we can fill in missing values with 'RL'
all_data['MSZoning'] = all_data['MSZoning'].fillna(all_data['MSZoning'].mode()[0])

# drop Utilities
all_data = all_data.drop(['Utilities'], axis=1)

# Functional : data description says NA means typical
all_data["Functional"] = all_data["Functional"].fillna("Typ")

# Electrical : It has one NA value. Since this feature has mostly 'SBrkr', we can set that for the missing value.
all_data['Electrical'] = all_data['Electrical'].fillna(all_data['Electrical'].mode()[0])

# KitchenQual: Only one NA value, and same as Electrical, we set 'TA' (which is the most frequent) for the missing value in KitchenQual.
all_data['KitchenQual'] = all_data['KitchenQual'].fillna(all_data['KitchenQual'].mode()[0])

# Exterior1st and Exterior2nd : Again Both Exterior 1 & 2 have only one missing value. We will just substitute in the most common string
all_data['Exterior1st'] = all_data['Exterior1st'].fillna(all_data['Exterior1st'].mode()[0])
all_data['Exterior2nd'] = all_data['Exterior2nd'].fillna(all_data['Exterior2nd'].mode()[0])

# SaleType : Fill in again with most frequent which is "WD"
all_data['SaleType'] = all_data['SaleType'].fillna(all_data['SaleType'].mode()[0])

# MSSubClass : Na most likely means No building class. We can replace missing values with None
all_data['MSSubClass'] = all_data['MSSubClass'].fillna("None")

# check is there any remaining missing value
all_data_na_re = (all_data.isnull().sum() / len(all_data))*100
all_data_na_re = all_data_na_re.drop(all_data_na_re[all_data_na_re == 0].index).sort_values(ascending=False)
missing_data_re = pd.DataFrame({'Missing ratio': all_data_na_re})
print(missing_data_re.head(5))
4.更多特征工程
4.1 转换特征为类别特征
# Transforming some numerical variables that are really categorical

# MSSubClass = the building class
all_data['MSSubClass'] = all_data['MSSubClass'].apply(str)

# changing overallcond into a categorical variable
all_data['OverallCond'] = all_data['OverallCond'].astype(str)

# year and month sold are transformed into categorical features
all_data['YrSold'] = all_data['YrSold'].astype(str)
all_data['MoSold'] = all_data['MoSold'].astype(str)
4.2 编码类别特征
使用sklearn的LabelEncoder方法将类别特征(离散型)编码为0~n-1之间连续的特征数值
# Label Encoding some categorical variables that may contain information in their ordering set
from sklearn.preprocessing import LabelEncoder
cols = ('FireplaceQu', 'BsmtQual', 'BsmtCond', 'GarageQual', 'GarageCond',
        'ExterQual', 'ExterCond','HeatingQC', 'PoolQC', 'KitchenQual', 'BsmtFinType1',
        'BsmtFinType2', 'Functional', 'Fence', 'BsmtExposure', 'GarageFinish', 'LandSlope',
        'LotShape', 'PavedDrive', 'Street', 'Alley', 'CentralAir', 'MSSubClass', 'OverallCond',
        'YrSold', 'MoSold')
# process columns, apply LabelEncoder to categorical features
for c in cols:
    lbl = LabelEncoder()
    lbl.fit(list(all_data[c].values))
    all_data[c] = lbl.transform(list(all_data[c].values))

# shape
print('Shape all_data: {}'.format(all_data.shape))
4.3 增加更重要的特征
房屋面积往往会决定一个房屋的价格,因此这里面将所有房屋面积累积成一个总的面积特征
# Since area related features are very important to determine house prices
# we add one more feature which is the total area of basement, first and second floor areas of each house
# adding total sqfootage feature
all_data['TotalSF'] = all_data['TotalBsmtSF'] + all_data['1stFlrSF'] + all_data['2ndFlrSF']
4.4 特征偏度
我们一般都期望数据的分布 符合正态,但是有时候实际得到的数据不是这样的。
首先我们检查数值型特征数据的偏度(skewness),但是要注意,object类型的数据无法计算skewness,因此计算的时候要过滤掉object数据。
umeric_feats = all_data.dtypes[all_data.dtypes != 'object'].index

# check the skew of all numerical features
skewed_feats = all_data[numeric_feats].apply(lambda x: skew(x.dropna())).sort_values(ascending=False)
skewness = pd.DataFrame({'Skew': skewed_feats})
print(skewness.head(10))
对于偏度过大的特征数据利用sklearn的box-cox转换函数,以降低数据的偏度
# box cox transformation of highly skewed features
# box cox转换的知识可以google
skewness = skewness[abs(skewness) > 0.75]
print('there are {} skewed numerical features to Box Cox transform'.format(skewness.shape[0]))
from scipy.special import boxcox1p
skewed_feats_index = skewness.index
lam = 0.15
for feat in skewed_feats_index:
    all_data[feat] = boxcox1p(all_data[feat], lam)
4.5 One-Hot编码
使用pandas的dummy方法来进行数据独热编码,并形成最终的训练和测试数据集
# getting dummy categorical features onehot???
all_data = pd.get_dummies(all_data)
print(all_data.shape)

# getting the new train and test sets
train = all_data[:n_train]
test = all_data[n_train:]
三、模型
1. 导入需要的包和交叉验证策略
这里使用sklearn的交叉验证函数cross_val_score(使用详情可参见官网api),由于该函数并没有shuffle的功能,我们还需要额外的kfold函数来对数据集进行随机分割。
# import lib
from sklearn.linear_model import ElasticNet, Lasso, BayesianRidge, LassoLarsIC
from sklearn.ensemble import RandomForestRegressor, GradientBoostingRegressor
from sklearn.kernel_ridge import KernelRidge
from sklearn.pipeline import make_pipeline
from sklearn.preprocessing import RobustScaler
from sklearn.base import BaseEstimator, TransformerMixin, RegressorMixin, clone
from sklearn.model_selection import KFold, cross_val_score, train_test_split
from sklearn.metrics import mean_squared_error
import xgboost as xgb
# import lightgbm as lgb 当前环境无法使用

# Define a cross validation strategy
# We use the cross_val_score function of Sklearn. However this function has not a shuffle attribut,
# we add then one line of code, in order to shuffle the dataset prior to cross-validation

def rmsle_cv(model):
    kf = KFold(n_splits=5, shuffle=True, random_state=42).get_n_splits(train.values)
    rmse = np.sqrt(-cross_val_score(model, train.values, y_train, scoring="neg_mean_squared_error", cv = kf))
    return rmse
2. 基础模型
下面介绍sklearn中几种常见的模型,Lasso Regression、Elastic Net Regression、Kernel Ridge Regression、Gradient Boosting Regression、Xgboost和LightGBM(当前这个模型由于mac环境的影响未运行成功,xgboost和lightgbm非sklearn的包,需要额外安装)
# base models
# LASSO regression : this model very sensitive to outliers need to make it more robust
lasso = make_pipeline(RobustScaler(), Lasso(alpha=0.0005, random_state=1))

# Elastic Net Regression : again made robust to outliers
enet = make_pipeline(RobustScaler(), ElasticNet(alpha=0.0005, l1_ratio=0.9, random_state=3))

# Kernel Ridge Regression:
krr = KernelRidge(alpha=0.6, kernel='polynomial', degree=2, coef0=2.5)

# Gradient boosting regression:with huber loss that makes it robust to outliers
gboost = GradientBoostingRegressor(n_estimators=3000, learning_rate=0.05, max_depth=4, max_features='sqrt',
                                   min_samples_leaf=15, min_samples_split=10, loss='huber', random_state=5)

# Xgboost:
xgb_model = xgb.XGBRegressor(colsample_bytree=0.4603, gamma=0.0468, learning_rate=0.05, max_depth=3,
                             min_child_weight=1.7817, n_estimators=2200, reg_alpha=0.4640, reg_lambda=0.8571,
                             subsample=0.5213, silent=1, random_state=7, nthread=-1)

# LightGBM 居多变化 原版本和现版本差距太大 当前mac环境未加载成功
# lgb_model = lgb.LGBMRegressor(objective='regression', num_leaves=5, learning_rate=0.05, n_estimators=720)
3. 基础模型的得分
使用rmsle_cv函数对各个模型计算rmse的得分情况
# base models scores
score = rmsle_cv(lasso)
print("\nLasso score: {:.4f} ({:.4f})\n".format(score.mean(), score.std()))

score = rmsle_cv(enet)
print("ElasticNet score: {:.4f} ({:.4f})\n".format(score.mean(), score.std()))

score = rmsle_cv(krr)
print("Kernel Ridge score: {:.4f} ({:.4f})\n".format(score.mean(), score.std()))

score = rmsle_cv(gboost)
print("Gradient Boosting score: {:.4f} ({:.4f})\n".format(score.mean(), score.std()))

score = rmsle_cv(xgb_model)
print("Xgboost score: {:.4f} ({:.4f})\n".format(score.mean(), score.std()))

# score = rmsle_cv(lgb_model)
# print("LightGBM score: {:.4f} ({:.4f})\n".format(score.mean(), score.std()))
四、Stacking模型
1. 简单的Stacking模型:均化基础模型
这里新建了一个继承scikit-learn的均化模型类,然后重写了fit和predict方法,其实就是用数据拟合不同的模型,然后将所有的基础模型的预测结果累加取平均值作为当前均化模型的预测结果。
# averaged base models class
class AveragingModels(BaseEstimator, RegressorMixin, TransformerMixin):
    def __init__(self, models):
        self.models = models

    # we define clones of the original models to fit the data in
    def fit(self, X, y):
        self.models_ = [clone(x) for x in self.models]

        # train cloned base models
        for model in self.models_:
            model.fit(X, y)

        return self

    # we do the predictions for cloned models and average them
    def predict(self, X):
        predictions = np.column_stack([
            model.predict(X) for model in self.models_
        ])
        return np.mean(predictions, axis=1)
定义完均化模型,然后使用前面定义好的enet、gboost、krr和lasso基础模型,当然也可以加入其他的基础模型。
测试均化模型的rmse得分
# averaged base models score
# we just average four models here enet gboost krr lasso
averaged_models = AveragingModels(models=(enet, gboost, krr, lasso))

score_all = rmsle_cv(averaged_models)
print('Averaged base models score: {:.4f} ({:.4f})\n'.format(score_all.mean(), score_all.std()))
基础模型和均化模型的得分情况如下:
- Lasso score:0.1115(0.0074)
- ElasticNet score:0.1116(0.0074)
- Kernel Ridge score:0.1153(0.0075)
- Gradient Boosting score:0.1168(0.0083)
- Averaged base models score:0.1087(0.0077)
可以看出,均化模型能够提升效果。
2. 在Stacking模型基础上加入元模型
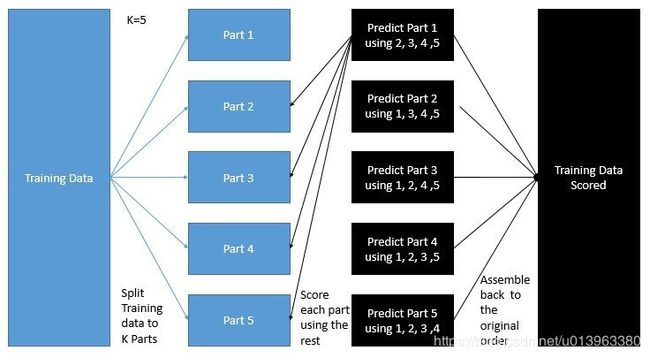
这里在均化模型基础上加入元模型,然后在这些基础模型上使用折外预测(out-of-folds)来训练我们的元模型,其训练步骤如下:
- 1 将训练集分出2个部分:train_a和train_b
- 2 用train_a来训练其他基础模型
- 3 然后用其训练模型在测试集train_b上进行预测
- 4 使用步骤3中中的预测结果作为输入,然后在其元模型上进行训练
如下图所示(图片来自:KazAnovas interview),如果我们使用五折stacking方法,一般情况下,我们会将训练集分为5个部分,每次的训练中都会使用其中4个部分的数据集,然后使用最后一个部分数据集来预测,五次迭代后我们会得到五次预测结果,最终使用着五次结果作为元模型的输入进行元模型的训练(其预测目标变量不变)。在元模型的预测部分,我们会平均所有基础模型的预测结果作为元模型的输入进行预测。
其模型代码如下:
# Stacking averaged Models class
class StackingAveragedModels(BaseEstimator, RegressorMixin, TransformerMixin):
    def __init__(self, base_models, meta_model, n_folds=5):
        self.base_models = base_models
        self.meta_model = meta_model
        self.n_folds = n_folds

    # We again fit the data on clones of the original models
    def fit(self, X, y):
        self.base_models_ = [list() for x in self.base_models]
        self.meta_model_ = clone(self.meta_model)
        kfold = KFold(n_splits=self.n_folds, shuffle=True, random_state=156)

        # Train cloned base models then create out-of-fold predictions
        # that are needed to train the cloned meta-model
        out_of_fold_predictions = np.zeros((X.shape[0], len(self.base_models)))
        for i, model in enumerate(self.base_models):
            for train_index, holdout_index in kfold.split(X, y):
                instance = clone(model)
                self.base_models_[i].append(instance)
                instance.fit(X[train_index], y[train_index])
                y_pred = instance.predict(X[holdout_index])
                out_of_fold_predictions[holdout_index, i] = y_pred

        # Now train the cloned  meta-model using the out-of-fold predictions as new feature
        self.meta_model_.fit(out_of_fold_predictions, y)
        return self

    # Do the predictions of all base models on the test data and use the averaged predictions as
    # meta-features for the final prediction which is done by the meta-model
    def predict(self, X):
        meta_features = np.column_stack([
            np.column_stack([model.predict(X) for model in base_models]).mean(axis=1)
            for base_models in self.base_models_])
        return self.meta_model_.predict(meta_features)
下面,使用前面定义好的enet、gboost、krr基础模型,使用lasso作为元模型进行训练预测,并计算得分
stacked_averaged_models = StackingAveragedModels(base_models = (enet, gboost, krr), meta_model = lasso)
score_all_stacked = rmsle_cv(stacked_averaged_models)
print('Stacking Averaged base models score: {:.4f} ({:.4f})\n'.format(score_all_stacked.mean(), score_all_stacked.std()))
其结果是:Stacking Averaged base models score: 0.1081 (0.0073),我们再一次获得比之前模型更好的分数。
3. StackedRegressor,XGBoost和LightGBM模型集成
下面使用XGBoost和LightGBM和StackedRegressor集成。
首先定义rmsle评价函数:
# we first define a rmsle evaluation function
def rmsle(y, y_pred):
    return np.sqrt(mean_squared_error(y, y_pred))
分别训练XGBoost和LightGBM和StackedRegressor模型
# final training and prediction
stacked_averaged_models.fit(train.values, y_train)
stacked_train_pred = stacked_averaged_models.predict(train.values)
stacked_test_pred = np.expm1(stacked_averaged_models.predict(test.values))
print(rmsle(y_train, stacked_train_pred))

xgb_model.fit(train, y_train)
xgb_train_pred = xgb_model.predict(train)
xgb_test_pred = np.expm1(xgb_model.predict(test))
print(rmsle(y_train, xgb_train_pred))

# lgb_model.fit(train, y_train)
# lgb_train_pred = lgb_model.predict(train)
# lgb_pred = np.expm1(lgb_model.predict(test.values))
# print(rmsle(y_train, lgb_train_pred))
然后使用加权平均来集成XGBoost和LightGBM和StackedRegressor模型
# 这里lightgbm没有环境,直接使用xgb和stacked两个模型集成
print('RMSLE score on train data all models:')
print(rmsle(y_train, stacked_train_pred*0.7 + xgb_train_pred*0.30))

# Ensemble prediction 集成预测
ensemble_result = stacked_test_pred*0.7 + xgb_test_pred*0.30
五、生成结果提交
submission = pd.DataFrame()
submission['Id'] = test_ID
submission['SalePrice'] = ensemble_result
submission.to_csv('/Users/xudong/kaggleData/houseprice/submission.csv', index=False)
六、结果
最终结果得分是0.11674,排名是679

