Python决策树实例--电力窃漏电用户自动识别概述
背景与挖掘目标
简述:有很多窃电漏电行为,要根据已经有的训练集数据来诊断,构筑模型判断用户是否存在窃漏电行为
数据来源:
https://github.com/keefecn/python_practice_of_data_analysis_and_mining/tree/master/chapter6/demo
分析方法与过程
- 业务系统:原始数据(选择性抽取/实时抽取)
- 数据探索与预处理:数据清洗、缺失值处理、数据变换
- 建模样本数据(训练集):模型训练、模型评价
- 预处理后诊断模型(测试集):模型预测
- 诊断结果,模型优化与重构
数据量较大,直接进行数据预处理过程,开始构建模型
数据预处理
拉格朗日插值法填补缺失值
首先从原始数据集中确定因变量和自变量,去除缺失值前后5个数据(遇到空值则舍去),取五个是考虑总数据约为20行,有2-3个缺失值,前后取5则正好十个恰好均分。

代码如下(数据使用demo/data/missing_data.xls):
import pandas as pd
from scipy.interpolate import lagrange

inputfile = '路径/missing_data.xls'
outputfile = '路径/missing_data_processed.xls'
data = pd.read_excel(inputfile,header=None)

# S为列向量、n为被插值的位置、k为取前后的数据个数,我们默认取5
def ployinterp_column (s,n,k=5):
    # 取前后k列形成新的列表
    y = s[list(range(n-k,n))+ list(range(n+1,n+1+k))]
    # 去除空值
    y = y[y.notnull()]
    # 拉格朗日插值,返回结果
    return lagrange(y.index, list(y))(n)

#列表中逐个元素判断是否需要进行插值
for i in data.columns:
    for j in range(len(data)):
        # 为空则进行插值
        if (data[i].isnull())[j]:
            data[i][j] = ployinterp_column(data[i],j)

data.to_excel(outputfile,header=None,index=False)
特征选择
由于未展示原数据,特征选择部分直接列出合理选取的特征值
窃漏电指标评价体系:
- 电量趋势下降指标–用电趋势
- 线损指标–线损增长率
- 告警类指标–与窃漏电相关的终端告警数
模型构建
拆分训练集与测试集
代码如下(数据使用demo/data/model.xls):
import pandas as pd  # 导入数据分析库
from random import shuffle  # 导入随机函数shuffle,用来打算数据

datafile = '路径/model .xls'  # 数据名
data = pd.read_excel(datafile)  # 读取数据,数据的前三列是特征,第四列是标签
data = data.as_matrix()  # 将表格转换为矩阵

shuffle(data)  # 随机打乱数据

p = 0.8  # 设置训练数据比例
train = data[:int(len(data) * p), :]  # 前80%为训练集
test = data[int(len(data) * p):, :]  # 后20%为测试集
print(len(data), len(train), len(test))
决策树模型
# 构建CART决策树模型
# 导入决策树模型
from sklearn.tree import DecisionTreeClassifier

treefile = '路径/tree.pkl'  # 模型输出名字
tree = DecisionTreeClassifier()  # 建立决策树模型
tree.fit(train[:, :3], train[:, 3])  # 训练

# 保存模型
from sklearn.externals import joblib
joblib.dump(tree, treefile)

# 导入混淆矩阵函数
from sklearn.metrics import confusion_matrix
import matplotlib.pyplot as plt
plt.rc('figure',figsize=(5,5))
# 生成混淆矩阵
cm = confusion_matrix(train[:,3], tree.predict(train[:,:3]))
plt.matshow(cm,cmap = plt.cm.Blues) # 背景颜色
plt.colorbar()
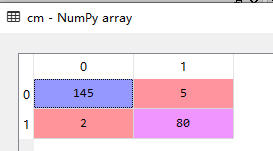
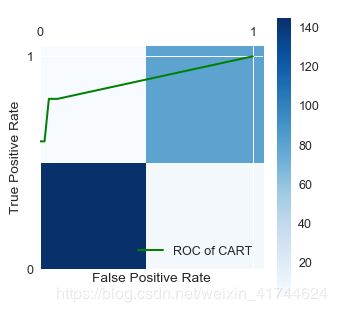
混淆矩阵分类准确率:(145+80)/(145+80+2+5)=0.969,证明模型有着不错的预测准度


模型评价
ROC曲线
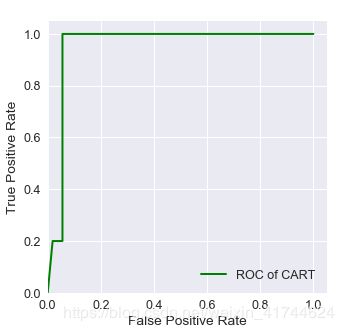
一个优秀分类器对应的ROC曲线应该尽量靠近左上角
代码如下:
def plot_roc(test, predict_result, label_name):

    from sklearn.metrics import roc_curve  # 导入ROC曲线函数

    fpr, tpr, thresholds = roc_curve(
        test[:, 3], predict_result, pos_label=1)
    plt.plot(fpr, tpr, linewidth=2, label='ROC of CART', color='green')  # 作出ROC曲线
    plt.xlabel('False Positive Rate')  # 坐标轴标签
    plt.ylabel('True Positive Rate')  # 坐标轴标签
    plt.ylim(0, 1.05)  # 边界范围
    plt.xlim(0, 1.05)  # 边界范围
    plt.legend(loc=4)  # 图例
    plt.show()  # 显示作图结果
    return plt
predict_result = tree.predict_proba(test[:, :3])[:, 1]
plot_roc(test, predict_result, 'ROC of CART')
将结果输出即可
