echarts 饼图以及图例的位置及大小,环图中间字
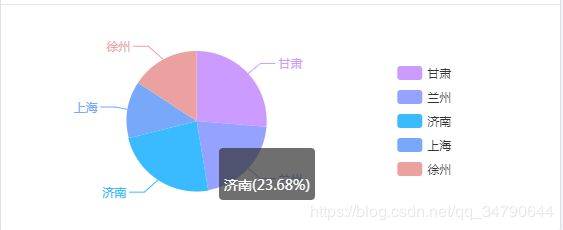
1. 如下图所示,图的位置大小以及图例的位置:
2. 代码如下图所示:legend位置(图例位置),radius大小(图大小),center位置(图位置)
var option = {
        title: {
          text: '',
          subtext: '',
          x: 'center'
        },
        tooltip: {
          trigger: 'item',
          formatter: "{a}
{b}({d}%)"
        },
        legend: {
          orient: 'vertical',
          left: '70%',  //图例距离左的距离
          y: 'center',  //图例上下居中
          data: ["甘肃","兰州","济南","上海","徐州"]
        },
        color: ['rgb(203,155,255)', 'rgb(149,162,255)', 'rgb(58,186,255)',
                'rgb(119,168,249)', 'rgb(235,161,159)'],//五个数据,五个颜色
        series: [
          {
            name: '',
            type: 'pie',
            radius: '70%',  //图的大小
            center: ['35%', '50%'], //图的位置,距离左跟上的位置
            data:[
              {
                name:"甘肃",
                value:'10'
              },
              {
                name:"兰州",
                value:'8'
              },
              {
                name:"济南",
                value:'9'
              },
              {
                name:"上海",
                value:'5'
              },
              {
                name:"徐州",
                value:'6'
              }
            ]
          }
        ]
      };
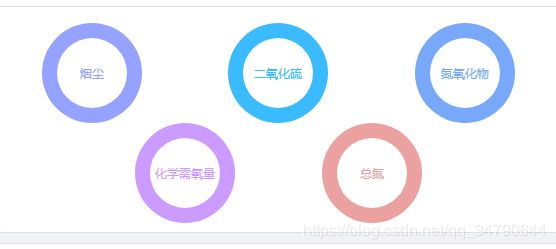
3. 环形中间文字,如下图所示:
4. 代码如下图所示:graphic中间文字设置以及一些样式
var option = {
          tooltip: {
            trigger: 'item',
            show: true,
            formatter: "{a}
{b}: {c} ({d}%)",
            textStyle: {
              align: 'right'
            },
          },
          color: ['rgb(149,162,255)'],
          legend: {
            orient: 'vertical',
            x: 'left',
            show: false,
            data: ['烟尘']
          },
          graphic: {
            type: 'text',
            left: 'center',
            top: 'center',
            style: {
              text: '烟尘',
              textAlign: 'center',
              fill: 'rgb(149,162,255)',
              width: 30,
              height: 30,
            }
          },
          series: [
            {
              name: '',
              type: 'pie',
              radius: ['70%', '100%'],
              avoidLabelOverlap: false,
              labelLine: {
                normal: {
                  show: false
                }
              },
              data: [{
                      value: 10,
                      name:"烟尘",
                      itemStyle: {
                              label: {
                              show: true,
                              position: 'inside'

                              },
                       },
                    }]
            }
          ]
        };

