利用周末学R语言 (1) - RStudio,helloworld,数据类型与获取数据
因为工作需要使用R语言,利用周末了解,记录这些属于R的周末
本系列每周末更新,不断修改中
R介绍
- 开源的,源于S语言的,主要用于统计计算和作图的语言.
- 优势: 简单易学,轻量,不同系统上兼容性好,包多,有RStudio这个优秀的IDE
- 劣势: 速度较慢,包质量参差不齐,数据量大的时候性能不好,在深度学习领域缺乏包
R安装
- R官网
- R-3.4.3-win下载链接
- 安装即可
- RStudio官网
- 下载链接
- 安装即可
RStudio使用
- RStudio界面
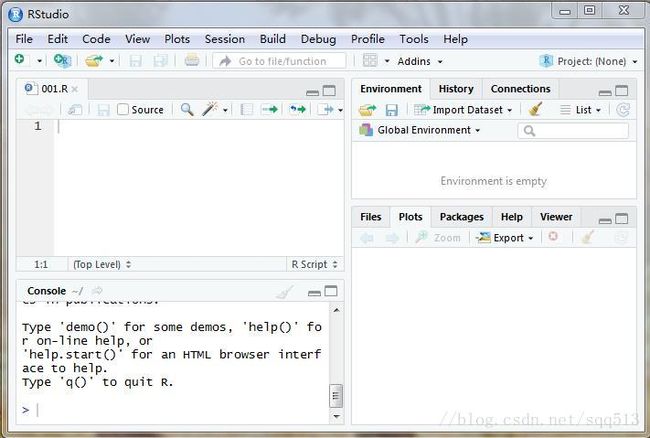
打开RStudio,左下console是控制台;左上是脚本输入界面;右上是工具栏,分别是环境,历史和连接;右下是多功能台,分别是files:查看文件,plots:显示图型,packages:当前下载和加载的包,help:帮助栏,viewer:数据预览.

- 定制R环境
# 每次执行R时会自动运行的命令,在以下文件中设置
# path="C:/Program Files/R/R-3.3.2/etc/Rprofile.site"
# 运行R时还会载入同目录的.Rprofile文件
# 如果没有还会尝试载入根目录下的.Rprofile文件
# 还可以定义.First函数>
# .First <- function() {
# options(prompt="$ ", continue="+\t")                      # $ 是提示符
# options(digits=5, length=999)                             # 定制数值和输出格式
# x11()                                                     # 定制图形环境
# par(pch = "+")                                            # 定制数据点的标示符
# source(file.path(Sys.getenv("HOME"), "R", "mystuff.R"))   # 个人编写的函数
# library(MASS)                                             # 导入包
# }
# 类似的是,如果定义了函数.Last(),它(常常)会在对话结束时执行。
Hello World!
- 完成你的第一个R语言数据分析,本章的示例代码多借鉴于 R in action
- 输入以下代码并运行
#这是一行注释
if(FALSE){
  这是
  多行注释
}
age <- c(1,3,5,2,11)
weight <- c(4.4,5.3,7.2,5.2,8.5)
mean(weight)
sd(weight)
cor(age,weight)
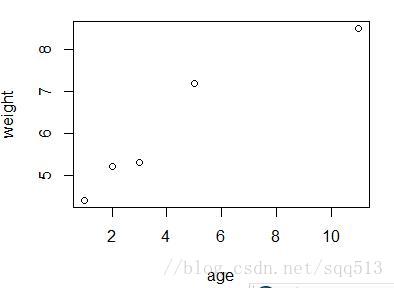
plot(age,weight)
控制台和多功能台会输入以下内容
> mean(weight)
[1] 6.12
> sd(weight)
[1] 1.681368
> cor(age,weight)
[1] 0.9561134数据类型
向量
a <- c(1,2,3,4,5)
a[c(1)]
# 输出 1

a[c(1,2)]
# 输出 1 2

a[c(2:4)]
# 输出 2 3 4
矩阵
- 矩阵基础
rnames <- c('r1','r2')
cnames <- c('c1','c2')
cells <- c(11,12,21,22)
mymatrix <- matrix(cells,nrow=2,ncol=2,byrow=TRUE,
                   dimnames=list(rnames,cnames))
mymatrix
# 输出
#    c1 c2
# r1 11 12
# r2 21 22

# byrow默认为FALSE
# 不指定rname和cname则为数字索引

mymatrix[2,]
# 输出
# c1 c2
# 21 22

mymatrix[,2]
# 输出
# r1 r2
# 12 22

mymatrix[2,2]
# 输出
# 22

mymatrix[2,c(1,2)]
# 输出
# c1 c2
# 21 22 - 矩阵工具
- 外积(矩阵/数组)
a <- matrix(c(1,2,3,4),nrow=2,ncol=2,byrow=TRUE)
b <- matrix(c(2,4,6,8),nrow=2,ncol=2,byrow=TRUE)
# 外积可以通过特别的操作符%o%实现
print(a %o% b)
# 或者使用outer函数
# print(outer(a,b))
输出
, , 1, 1

     [,1] [,2]
[1,]    2    4
[2,]    6    8

, , 2, 1

     [,1] [,2]
[1,]    6   12
[2,]   18   24

, , 1, 2

     [,1] [,2]
[1,]    4    8
[2,]   12   16

, , 2, 2

     [,1] [,2]
[1,]    8   16
[2,] 24 32- 矩阵相乘
print(a %*% b)
# crossprod等同于t(a) %*% b,矢积
print(crossprod(a,b))
# 生成对角矩阵
print(diag(c(1,2,3,4)))
# 返回对角元素
print(diag(diag(c(1,2,3,4))))
# 生成空矩阵
print(diag(4))
输出
     [,1] [,2]
[1,]   14   20
[2,]   30   44
     [,1] [,2]
[1,]   20   28
[2,]   28   40
     [,1] [,2] [,3] [,4]
[1,]    1    0    0    0
[2,]    0    2    0    0
[3,]    0    0    3    0
[4,]    0    0    0    4
[1] 1 2 3 4
     [,1] [,2] [,3] [,4]
[1,]    1    0    0    0
[2,]    0    1    0    0
[3,]    0    0    1    0
[4,] 0 0 0 1- 行数列数
d <- matrix(c(1:12),nrow=3,ncol=4,byrow=TRUE)
print(d)
print(nrow(d))
print(ncol(d))
返回
     [,1] [,2] [,3] [,4]
[1,]    1    2    3    4
[2,]    5    6    7    8
[3,]    9   10   11   12
[1] 3
[1] 4- 求解线性方程
# solve(矩阵积,其中一个矩阵)- 求逆
# slove(矩阵)- 有待添加的部分,来自R导论p41*
# 特征值和特征向量
# 奇异值分解和行列式
# 最小二乘法拟合和QR 分解
# 用cbind() 和rbind() 构建分块矩阵
# 对数组实现连接操作的函数c()
# 因子的频率表
数组
# 高维矩阵
dim1 <- c("a1","a2")
dim2 <- c("b1","b2","b3")
dim3 <- c("c1","c2","c3","c4")
z <- array(1:24,c(2,3,4),dimnames=list(dim1, dim2, dim3))
z
# 输出
# , , c1
#
#    b1 b2 b3
# a1  1  3  5
# a2  2  4  6
# , , c2
#    b1 b2 b3
# a1  7  9 11
# a2  8 10 12
# , , c3
#    b1 b2 b3
# a1 13 15 17
# a2 14 16 18
# , , c4
#    b1 b2 b3
# a1 19 21 23
# a2 20 22 24
数据框
id <- c(1,2,3,4)
age <- c(25,34,28,52)
diabetes <- c("type1", "type2", "type1", "type2")
status <- c("poor","improved","excellent","poor")
patientdata <- data.frame(id,age,diabetes,status)
patientdata
# 输出
#   id age diabetes    status
# 1  1  25    type1      poor
# 2  2  34    type2  improved
# 3  3  28    type1 excellent
# 4  4  52    type2      poor

# 选取行
patientdata[,1]
patientdata[,1:2]
patientdata[,c(1,3)]

# 选取列
patientdata[1]
patientdata[1:2]
patientdata[c(1,3)]
patientdata["age"]
patientdata[c("age","status")]
patientdata$status
table(patientdata$status,patientdata$age)

# 选取值
patientdata[1,2]
patientdata[1:2,1:2]
patientdata[c(1,3),c(1,3)]

# 符合数据框限制的列表可被函数as.data.frame() 强制转换成数据框
# as.data.frame(d)
因子(类似字典)
- 无序因子
diabetes <- c("type1", "type2", "type1", "type2")
diabetes <- factor(diabetes)
diabetes
type1 type2 type1 type2
Levels: type1 type2
- 有序因子
status <- c("poor","improved","excellent","poor")
status <- factor(status, order=TRUE, levels = c("poor","improved","excellent"))
status
poor improved excellent poor
Levels: poor < improved < excellent
- 因子的使用
state <- c("tas", "sa", "qld", "nsw", "nsw", "nt", "wa", "wa",
"qld", "vic", "nsw", "vic", "qld", "qld", "sa", "tas",
"sa", "nt", "wa", "vic", "qld", "nsw", "nsw", "wa",
"sa", "act", "nsw", "vic", "vic", "act")
statef <- factor(state)
# statef 是 因子
# print与直接输出对象,会有格式差异
print(statef)
[1] tas sa qld nsw nsw nt wa wa qld vic nsw vic qld qld sa tas sa nt wa
[20] vic qld nsw nsw wa sa act nsw vic vic act
Levels: act nsw nt qld sa tas vic wa
print(levels(statef))[1] “act” “nsw” “nt” “qld” “sa” “tas” “vic” “wa”
incomes <- c(60, 49, 40, 61, 64, 60, 59, 54, 62, 69, 70, 42, 56,
61, 61, 61, 58, 51, 48, 65, 49, 49, 41, 48, 52, 46,
59, 46, 58, 43)
print(incomes)
[1] 60 49 40 61 64 60 59 54 62 69 70 42 56 61 61 61 58 51 48 65 49 49 41 48 52
[26] 46 59 46 58 43
- 不同state的平均income
incmeans <- tapply(incomes, statef, mean)
print(incmeans)
act nsw nt qld sa tas vic wa
44.50000 57.33333 55.50000 53.60000 55.00000 60.50000 56.00000 52.25000
- 不同state的income的sd
incster <- tapply(incomes, statef, sd)
print(incster)
act nsw nt qld sa tas vic
2.1213203 10.5577775 6.3639610 9.1815031 5.4772256 0.7071068 11.7260394
wa
5.3150729
- 不同state的income的95%置信区间(使用正态分布)
test <- function (x,perc) (c(mean(x)-qnorm(perc)*sd(x),
                     mean(x)+qnorm(perc)*sd(x)))
inctest <- tapply(incomes, statef, test, .95)
print(head(inctest))
$act
[1] 41.01074 47.98926
$nsw
[1] 39.96733 74.69933
$nt
[1] 45.03222 65.96778
$qld
[1] 38.49777 68.70223
$sa
[1] 45.99077 64.00923
$tas
[1] 59.33691 61.66309
- 有序因子2
print(ordered(state))[1] tas sa qld nsw nsw nt wa wa qld vic nsw vic qld qld sa tas sa nt wa
[20] vic qld nsw nsw wa sa act nsw vic vic act
Levels: act < nsw < nt < qld < sa < tas < vic < wa
列表
# 可放入各种类型的数据,可以命名,使用[[]]访问
g <- "my list"
h <- c(25,26,18,39)
j <- matrix(1:10,nrow=5)
k <- c("one","two","three")
mylist <- list(title=g, age=h, j, k)
mylist
# 输出
# $title
# [1] "my list"
# $age
# [1] 25 26 18 39
# [[3]]
#      [,1] [,2]
# [1,]    1    6
# [2,]    2    7
# [3,]    3    8
# [4,]    4    9
# [5,]    5   10
# [[4]]
# [1] "one"   "two"   "three"
其他
- 绑定,解绑和with
# 绑定数据框
attach(data)
# 解绑数据框
detach(date)
# with数据框
with(data, {
#语句
#<- 赋值局域变量
#<<- 赋值全局变量
})- 实例标识符(行名,index列),在定义时指定
row.names=XXX常用数据对象处理函数
| 函数 | 用途 |
|---|---|
| length(object) | 显示对象中元素/成分的数量 |
| dim(object) | 显示某个对象的维度 |
| str(object) | 显示某个对象的结构 |
| class(object) | 显示某个对象的类或类型 |
| mode(object) | 显示某个对象的模式 |
| names(object) | 显示某对象中各成分的名称 |
| c(object, object,…) | 将对象合并入一个向量 |
| cbind(object, object, …) | 按列合并对象 |
| rbind(object, object, …) | 按行合并对象 |
| head(object) | 列出某个对象的开始部分 |
| tail(object) | 列出某个对象的最后部分 |
| ls() | 显示当前的对象列表 |
| rm(object, object, …) | 删除一个或更多个对象。 |
| rm(list = ls()) | 将删除当前工作环境中的几乎所有对象 |
| newobject (小于号)- edit(object) | 在编辑器中编辑对象并另存为newobject |
| fix(object) | 直接在编辑器中编辑对象 |
导入外部数据
- 访问内置数据
# R 提供了大约100个内置的数据集
# (在包datasets 中)
# 查看内置数据集
# data()

# 可以直接访问
print(head(islands))- 读取文本文件
df1 <- read.table("test.txt", sep="\t",
                 header = TRUE, row.names = "id")
# 读取用tab分隔,第一行是变量名的test.txt文件生成数据框,并将id列作为标识符
df1
# 输出
#   name age salary
# 1  ann  18   2000
# 2  bob  20   3000
# 3 cand  21   4000
# 4 done  17   5000
# 5 elle  28   3500

# 用逗号分隔就可以读取CSV文件了- 读取excel
# 国内可选择使用清华源
options(repos=structure(c(CRAN="https://mirrors.tuna.tsinghua.edu.cn/CRAN/")))
# install.packages("readxl")
# 显示sheet名
excel_sheets("test.xlsx")
# 读取excel
df2 <- read_excel("test.xlsx",sheet = "test1")
# sheet可指定名字或者位置
# 可限定需要读取的cell,使用以下参数
# n_max = 3, range = cell_rows(1:4)/ cell_cols("B:D")/ "C1:E4"
# na = "xxx" # 将xxx作为na
df2
# 输出
# # A tibble: 5 x 4
#      id name    age salary
#
# 1    1. ann     18.  2000.
# 2    2. bob     20.  3000.
# 3    3. cand    21.  4000.
# 4    4. done    17.  5000.
# 5 5. elle 28. 3500.- 连接数据库,以MySQL为例
1.在mysql中建立test数据库中的test表,如下所示
mysql> use test;
Database changed

mysql> select * from test;
+----+------+-----+--------+
| id | name | age | salary |
+----+------+-----+--------+
|  1 | ann  |  18 |   2000 |
|  2 | bob  |  20 |   3000 |
|  3 | cand |  21 |   4000 |
|  4 | done |  17 |   5000 |
|  5 | elle |  28 |   3500 |
+----+------+-----+--------+
5 rows in set (0.00 sec)
2.安装RMySQL
install.packages("RMySQL")3.连接数据库
library(RMySQL)
con <- dbConnect(MySQL(), host="localhost", dbname="test",
user="root", password="Sqq123456!")
# linux用户可在~/.my.cnf文件中添加
# [test]
# user = 用户名
# password = 密码
# host = host
# database = 数据库
# 可使用以下语句快速连接
# con <- dbConnect(MySQL(), group="test")
4.导入数据
dbListTables(con)
# 输出
# "test"
dbListFields(con, "test")
# 输出
# "id"     "name"   "age"    "salary"
df3 = dbReadTable(con, "test")
df3
# 输出
# id name age salary
# 1  1  ann  18   2000
# 2  2  bob  20   3000
# 3  3 cand  21   4000
# 4  4 done  17   5000
# 5  5 elle  28   3500
5.使用SQL语句
res <- dbSendQuery(con, "SELECT * FROM test WHERE id = 2")
dbFetch(res)
# 输出
#   id name age salary
# 1  2  bob  20   3000
dbClearResult(res)
# 输出
# TRUE
6.分块读取数据
res <- dbSendQuery(con, "SELECT * FROM test")
while(!dbHasCompleted(res)){
  chunk <- dbFetch(res, n = 2)
  print(chunk)
}
# 输出
#   id name age salary
# 1  1  ann  18   2000
# 2  2  bob  20   3000
#   id name age salary
# 1  3 cand  21   4000
# 2  4 done  17   5000
#   id name age salary
# 1  5 elle  28   3500
dbClearResult(res)
# 输出
# TRUE
7.断开连接
dbDisconnect(con)
# 输出
# TRUE
利用周末学R语言-系列地址
利用周末学R语言 (1) - RStudio,helloworld,数据类型与获取数据
利用周末学R语言 (2) - 画图
利用周末学R语言 (3) - 数据处理
利用周末学R语言 (4) - 控制流,函数,面向对象
统计建模等更多内容见 github.com/nightttt7/Rweekends
- 因jupyter notebook格式更适合展示,新内容将只放在github上,旧内容不定时更新
