LSTM 原理
import numpy as np
import pandas as pd
import matplotlib.pyplot as plt
import math
from keras.models import Sequential
from keras.layers import Dense, LSTM
from sklearn.preprocessing import MinMaxScaler
from sklearn.metrics import mean_squared_error

np.random.seed(7)

def create_dataset(dataset, look_back=1):
    dataX, dataY = [], []
    for i in range(len(dataset)-look_back-1):
        a = dataset[i:(i+look_back), 0]
        dataX.append(a)
        dataY.append(dataset[i + look_back, 0])
    return np.array(dataX), np.array(dataY)

dataframe = pd.read_csv('../input/traininggoogleprices/TrainPrices.csv', usecols=[1])
dataset = dataframe.values
dataset = dataset.astype('float32')
# normalize the dataset
scaler = MinMaxScaler(feature_range=(0, 1))
dataset = scaler.fit_transform(dataset)

train_size = int(len(dataset) * 0.9)
test_size = len(dataset) - train_size
train, test = dataset[0:train_size,:], dataset[train_size:len(dataset),:]

look_back=1
trainX, trainY = create_dataset(train, look_back)
testX, testY = create_dataset(test, look_back)
# reshape input to be [samples, time steps, features]
trainX = np.reshape(trainX, (trainX.shape[0], 1, trainX.shape[1]))
testX = np.reshape(testX, (testX.shape[0], 1, testX.shape[1]))

# create and fit the LSTM network
model = Sequential()
model.add(LSTM(128,activation='tanh', input_shape=(1, look_back), return_sequences=True))
model.add(LSTM(128,activation='tanh', input_shape=(1, look_back),return_sequences=False))
model.add(Dense(1, activation='relu'))
model.compile(loss='mse', optimizer='RMSProp', metrics = ['accuracy'])
model.fit(trainX, trainY, epochs=10, batch_size=32, verbose=2)

# make predictions
trainPredict = model.predict(trainX)
testPredict = model.predict(testX)
# invert predictions
trainPredict = scaler.inverse_transform(trainPredict)
trainY = scaler.inverse_transform([trainY])
testPredict = scaler.inverse_transform(testPredict)
testY = scaler.inverse_transform([testY])

# calculate root mean squared error
trainScore = math.sqrt(mean_squared_error(trainY[0], trainPredict[:,0]))
print('Train Score: %.2f RMSE' % (trainScore))
testScore = math.sqrt(mean_squared_error(testY[0], testPredict[:,0]))
print('Test Score: %.2f RMSE' % (testScore))

# shift train predictions for plotting
trainPredictPlot = np.empty_like(dataset)
trainPredictPlot[:, :] = np.nan
trainPredictPlot[look_back:len(trainPredict)+look_back, :] = trainPredict

# shift test predictions for plotting
testPredictPlot = np.empty_like(dataset)
testPredictPlot[:, :] = np.nan
testPredictPlot[len(trainPredict)+(look_back*2)+1:len(dataset)-1, :] = testPredict

# plot baseline and predictions
plt.plot(scaler.inverse_transform(dataset))
plt.plot(trainPredictPlot)
plt.plot(testPredictPlot)
plt.show()
多变量时间序列预测
https://machinelearningmastery.com/time-series-prediction-lstm-recurrent-neural-networks-python-keras/
诸如长期短期记忆(LSTM)复发神经网络的神经网络能够几乎无缝地模拟多个输入变量的问题。这在时间序列预测中是一个很大的好处,其中古典线性方法难以适应多变量或多输入预测问题。
在本教程中,您将发现如何在Keras深度学习库中开发多变量时间序列预测的LSTM模型。
如何将原始数据集转换为可用于时间序列预测的内容。
如何准备数据并适应多变量时间序列预测问题的LSTM。
如何做出预测并将结果重新调整到原始单位。
目录
- 空气污染预测
- 数据准备
- 多变量时间序列预测
1. 空气污染预测
数据包括日期时间,称为PM2.5浓度的污染物,以及天气信息,包括露点,温度,压力,风向,风速和累积的降雪小时数。原始数据中的完整功能列表如下:
NO:行号
年:这一年的数据年
月份:这一行的数据月份
day:此行中的数据日
小时:小时数据在这行
pm2.5:PM2.5浓度
DEWP:露点
温度:温度
PRES:压力
cbwd:组合风向
Iws:累积风速
是:积雪时间
Ir:累积的下雨时数
我们可以使用这些数据并构建一个预测问题,鉴于天气条件和前几个小时的污染,我们预测在下一个小时的污染。
Beijing PM2.5 Data Set
2,数据准备
第一步是将日期时间信息整合为一个日期时间,以便我们可以将其用作熊猫的索引。
快速检查显示前24小时的pm2.5的NA值。因此,我们将需要删除第一行数据。在数据集中还有几个分散的“NA”值;我们现在可以用0值标记它们。
以下脚本加载原始数据集,并将日期时间信息解析为Pandas DataFrame索引。 “No”列被删除,然后为每列指定更清晰的名称。最后,将NA值替换为“0”值,并删除前24小时。
from pandas import read_csv
from datetime import datetime
# load data
def parse(x):
    return datetime.strptime(x, '%Y %m %d %H')
dataset = read_csv('raw.csv',  parse_dates = [['year', 'month', 'day', 'hour']], index_col=0, date_parser=parse)
dataset.drop('No', axis=1, inplace=True)
# manually specify column names
dataset.columns = ['pollution', 'dew', 'temp', 'press', 'wnd_dir', 'wnd_spd', 'snow', 'rain']
dataset.index.name = 'date'
# mark all NA values with 0
dataset['pollution'].fillna(0, inplace=True)
# drop the first 24 hours
dataset = dataset[24:]
# summarize first 5 rows
print(dataset.head(5))
# save to file
dataset.to_csv('pollution.csv')
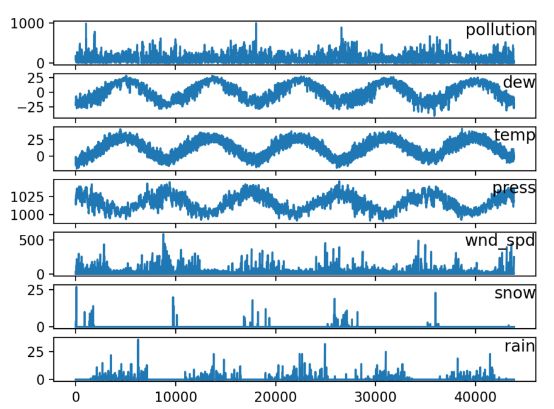
然后可以对其画图来看他们的分布情况:
from pandas import read_csv
from matplotlib import pyplot
# load dataset
dataset = read_csv('pollution.csv', header=0, index_col=0)
values = dataset.values
# specify columns to plot
groups = [0, 1, 2, 3, 5, 6, 7]
i = 1
# plot each column
pyplot.figure()
for group in groups:
    pyplot.subplot(len(groups), 1, i)
    pyplot.plot(values[:, group])
    pyplot.title(dataset.columns[group], y=0.5, loc='right')
    i += 1
pyplot.show()
多元LSTM预测
第一步是为LSTM准备污染数据集。
这涉及将数据集视为监督学习问题并对输入变量进行归一化。
考虑到上一个时间段的污染测量和天气条件,我们将把监督学习问题作为预测当前时刻(t)的污染情况。
这个表述是直接的,只是为了这个演示。您可以探索的一些替代方案包括:
根据过去24小时的天气情况和污染,预测下一个小时的污染。
预测下一个小时的污染,并给予下一个小时的“预期”天气条件。
我们可以使用在博客文章中开发的series_to_supervised()函数来转换数据集:
# convert series to supervised learning
def series_to_supervised(data, n_in=1, n_out=1, dropnan=True):
    n_vars = 1 if type(data) is list else data.shape[1]
    df = DataFrame(data)
    cols, names = list(), list()
    # input sequence (t-n, ... t-1)
    for i in range(n_in, 0, -1):
        cols.append(df.shift(i))
        names += [('var%d(t-%d)' % (j+1, i)) for j in range(n_vars)]
    # forecast sequence (t, t+1, ... t+n)
    for i in range(0, n_out):
        cols.append(df.shift(-i))
        if i == 0:
            names += [('var%d(t)' % (j+1)) for j in range(n_vars)]
        else:
            names += [('var%d(t+%d)' % (j+1, i)) for j in range(n_vars)]
    # put it all together
    agg = concat(cols, axis=1)
    agg.columns = names
    # drop rows with NaN values
    if dropnan:
        agg.dropna(inplace=True)
    return agg

# load dataset
dataset = read_csv('pollution.csv', header=0, index_col=0)
values = dataset.values
# integer encode direction
encoder = LabelEncoder()
values[:,4] = encoder.fit_transform(values[:,4])
# ensure all data is float
values = values.astype('float32')
# normalize features
scaler = MinMaxScaler(feature_range=(0, 1))
scaled = scaler.fit_transform(values)
# frame as supervised learning
reframed = series_to_supervised(scaled, 1, 1)
# drop columns we don't want to predict
reframed.drop(reframed.columns[[9,10,11,12,13,14,15]], axis=1, inplace=True)
print(reframed.head())
这个数据准备很简单,我们可以探索更多。您可以看到的一些想法包括:
one-hot 编码。
使所有系列均匀分散和季节性调整。
提供超过1小时的输入时间步长。
最后一点可能是最重要的,因为在学习序列预测问题时,LSTMs通过时间使用反向传播。
定义和拟合模型
在本节中,我们将适合多变量输入数据的LSTM。
首先,我们必须将准备好的数据集分成列车和测试集。为了加快对这次示范的模式培训,我们将仅适用于数据第一年的模型,然后对其余4年的数据进行评估。如果您有时间,请考虑浏览此测试工具的倒置版本。
下面的示例将数据集分成列车和测试集,然后将列车和测试集分成输入和输出变量。最后,将输入(X)重构为LSTM预期的3D格式,即[样本,时间步长,特征]。
# split into train and test sets
values = reframed.values
n_train_hours = 365 * 24
train = values[:n_train_hours, :]
test = values[n_train_hours:, :]
# split into input and outputs
train_X, train_y = train[:, :-1], train[:, -1]
test_X, test_y = test[:, :-1], test[:, -1]
# reshape input to be 3D [samples, timesteps, features]
train_X = train_X.reshape((train_X.shape[0], 1, train_X.shape[1]))
test_X = test_X.reshape((test_X.shape[0], 1, test_X.shape[1]))
print(train_X.shape, train_y.shape, test_X.shape, test_y.shape)

# design network
model = Sequential()
model.add(LSTM(50, input_shape=(train_X.shape[1], train_X.shape[2])))
model.add(Dense(1))
model.compile(loss='mae', optimizer='adam')
# fit network
history = model.fit(train_X, train_y, epochs=50, batch_size=72, validation_data=(test_X, test_y), verbose=2, shuffle=False)
# plot history
pyplot.plot(history.history['loss'], label='train')
pyplot.plot(history.history['val_loss'], label='test')
pyplot.legend()
pyplot.show()
