MATLAB笔记之基本初等复变函数画法(3维)
MATLAB笔记之基本初等复变函数画法(3维)
QQ:3020889729 小蔡
- 复幂函数与实幂函数(调用cplxmap绘制)
- 复指数函数与实指数函数(调用cplxmap绘制)
- 复三角函数与实三角函数(调用cplxmap绘制)
- 复双曲函数与实双曲函数(调用cplxmap绘制)
- 复反三角函数与实反三角函数(调用cplxmap绘制)
- 复根式函数与实根式函数(调用cplxroot绘制)
- 复对数函数与实对数函数(调用cplxmap绘制)
- 基本初等复变函数的绘制总结
- 调用MATLAB函数产生极坐标复网格
- 调用MATLAB函数产生对应复数的复变函数图形
- 调用MATLAB函数产生对应复数的根式函数图形
- 以上函数实现都是满足,在三维图形中,用颜色变化体现4维变化
- 最后,放上绘制复变根式函数和复变一般函数的绘制函数内容(是库函数)
- z = cplxgrid(m) 创建
- cplxroot(n,m)
- cplxmap(z,f(z))
QQ:3020889729 小蔡
四维图形的绘制,以三维加上颜色变化表现思维。
复幂函数与实幂函数(调用cplxmap绘制)
代码:
% 复幂函数
z = cplxgrid(30);
subplot(2,1,1);
cplxmap(z,z.^2);%幂函数z^n
colorbar('vert');
title('复幂函数');
%for i = 1:1:10;
    %subplot(5,2,i);
    %cplxmap(z,z.^i);
%end
% 实幂函数
x = 0:0.1:1;
y = x.^2;
subplot(2,1,2);
plot(x,y);
title('实幂函数');
复指数函数与实指数函数(调用cplxmap绘制)
代码:
% 复指数函数
z = cplxgrid(30);
subplot(2,1,1);
cplxmap(z,exp(z));%指数函数exp
colorbar('vert');
title('复指数函数');
% 实指数函数
x = 0:0.1:1;
y = exp(x);
subplot(2,1,2);
plot(x,y);
title('实指数函数');
复三角函数与实三角函数(调用cplxmap绘制)
代码:
% 复三角函数
z = cplxgrid(30);
subplot(2,2,1);
cplxmap(z,sin(z));%三角函数sin
colorbar('vert');
title('复正弦函数');
subplot(2,2,2);
cplxmap(z,cos(z));%三角函数cos
colorbar('vert');
title('复余弦函数');
% 实三角函数
x = 0:0.1:2*pi;
y = sin(x);
subplot(2,2,3);
plot(x,y);
title('实正弦函数');
y = cos(x);
subplot(2,2,4);
plot(x,y);
title('实余弦函数');
复双曲函数与实双曲函数(调用cplxmap绘制)
代码:
% 复双曲函数
z = cplxgrid(30);
subplot(2,2,1);
cplxmap(z,sinh(z));%双曲函数sin
colorbar('vert');
title('复双曲正弦函数');
subplot(2,2,2);
cplxmap(z,cosh(z));%双曲函数cos
colorbar('vert');
title('复双曲余弦函数');
% 实双曲函数
x = 0:0.1:2*pi;
y = sinh(x);
subplot(2,2,3);
plot(x,y);
title('实双曲正弦函数');
y = cosh(x);
subplot(2,2,4);
plot(x,y);
title('实双曲余弦函数');
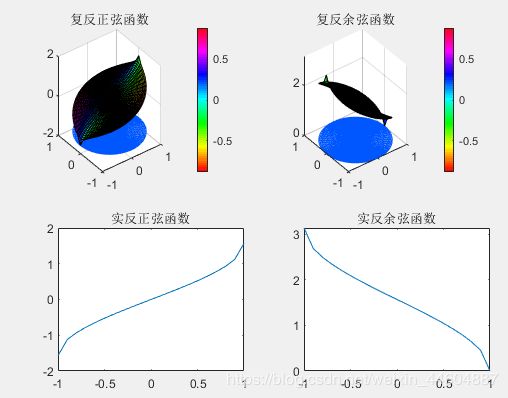
复反三角函数与实反三角函数(调用cplxmap绘制)
代码:
% 复反三角函数
z = cplxgrid(30);
subplot(2,2,1);
cplxmap(z,asin(z));
title('复反正弦函数');%反正弦函数:asin
colorbar('vert');
subplot(2,2,2);
cplxmap(z,acos(z));
colorbar('vert');
title('复反余弦函数');
% 实反三角函数
x = -1:0.1:1;
y = asin(x);%正负相加总值不变——3.1416:-1.5708~1.5708
subplot(2,2,3);
plot(x,y);
title('实反正弦函数');
y = acos(x);%正值——0~3.1416
subplot(2,2,4);
plot(x,y);
title('实反余弦函数');
复根式函数与实根式函数(调用cplxroot绘制)
代码:
% 复根式函数
z = cplxgrid(30);
subplot(2,1,1);
cplxroot(2);% 根式:1/2——包含多根多解的情况
colorbar('vert');
title('复根式函数');
% 实根式函数
x = 0:0.1:2;
y = x.^(1/2);%根式:x^(1/2)
subplot(2,1,2);
plot(x,y);
title('实根式函数');
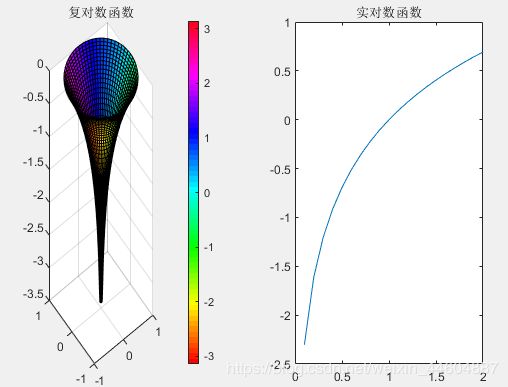
复对数函数与实对数函数(调用cplxmap绘制)
代码:
% 复对数函数
z = cplxgrid(30);
subplot(1,2,1);
cplxmap(z,log(z));%对数函数:f(z)=log(z)
colorbar('vert');
title('复对数函数');
% 实对数函数
x = 0:0.1:2;
y = log(x);%对数函数:log(x)
subplot(1,2,2);
plot(x,y);
title('实对数函数');
基本初等复变函数的绘制总结
调用MATLAB函数产生极坐标复网格
function cplxgrid(m) 创建极坐标复网格
调用MATLAB函数产生对应复数的复变函数图形
function cplxmap(z,f(z)) 求解复变函数图形
调用MATLAB函数产生对应复数的根式函数图形
function cplxroot(n,m) 求解根式——1/n,m参数不传入,默认值为20
以上函数实现都是满足,在三维图形中,用颜色变化体现4维变化
colorbar(‘vert’)
添加颜色栏,以作为四维的判别值。
最后,放上绘制复变根式函数和复变一般函数的绘制函数内容(是库函数)
之所以加上这部分,是因为也许你有时候需要特别创建一个复数参数矩阵/其它用于画图,这时候可以依照函数模型去构造。
z = cplxgrid(m) 创建
function z = cplxgrid(m)
%CPLXGRID Polar coordinate complex grid.:极坐标复网格
%   Z = CPLXGRID(m) is an (m+1)-by-(2*m+1) complex polar grid.:创建一个(m+1)×(2*m+1)的复杂极坐标网格
%   See CPLXMAP.

%   Copyright 1984-2014 The MathWorks, Inc.

r = (0:m)'/m;
theta = pi*(-m:m)/m;
z = r * exp(i*theta);
cplxroot(n,m)
function cplxroot(n,m)
%CPLXROOT Riemann surface for the n-th root.:n次方根的黎曼曲面
%   CPLXROOT(n) renders the Riemann surface for the n-th root.:表示第n根的黎曼曲面。
%   CPLXROOT, by itself, renders the Riemann surface for the cube root.:本身为立方根呈现黎曼曲面。
%   CPLXROOT(n,m) uses an m-by-m grid.  Default m = 20.:使用m×m的网格。默认值m = 20。

%   C. B. Moler, 8-17-89, 7-20-91.
%   Copyright 1984-2014 The MathWorks, Inc.

% Use polar coordinates, (r,theta).
% Cover the unit disc n times.

if nargin < 1
   n = 3;
end
if nargin < 2
   m = 20;
end
r = (0:m)'/m;
theta = pi*(-n*m:n*m)/m;
z = r * exp(i*theta);
s = r.^(1/n) * exp(i*theta/n);

surf(real(z),imag(z),real(s),imag(s));
cplxmap(z,f(z))
function cplxmap(z,w,B)
%CPLXMAP Plot a function of a complex variable.:CPLXMAP绘制一个复变函数。
%   CPLXMAP(z,f(z),(optional bound)):绘制f(z)函数
%   Used by CPLXDEMO.
%
%   See also CPLXGRID.

%   Copyright 1984-2014 The MathWorks, Inc.

blue = 0.2;
x = real(z);
y = imag(z);
u = real(w);
v = imag(w);

if nargin > 2
   k = find((abs(w) > B) | isnan(abs(w)));
   if length(k) > 0
      u(k) = B*sign(u(k));
      v(k) = zeros(size(k));
      v = v/max(max(abs(v)));
      v(k) = NaN*ones(size(k));
   end
end

M = max(max(u));
m = min(min(u));
axis([-1 1 -1 1 m M]);
caxis([-1 1]);
s = ones(size(z));
mesh(x,y,m*s,blue*s);
hold on
surf(x,y,u,v);
hold off
colormap(hsv(64))


