Matplotlib绘制高斯核概率分布(Gaussian kernel density estimator)等实战
Exercise 11.1
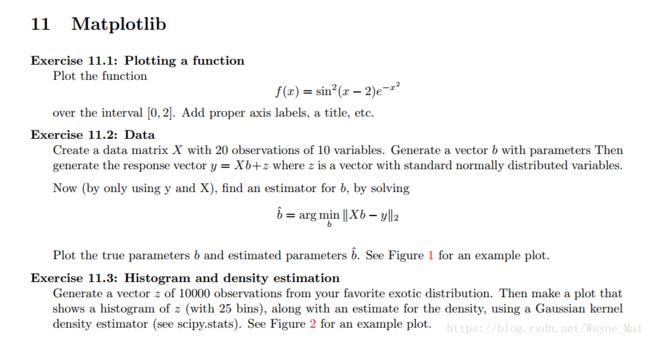
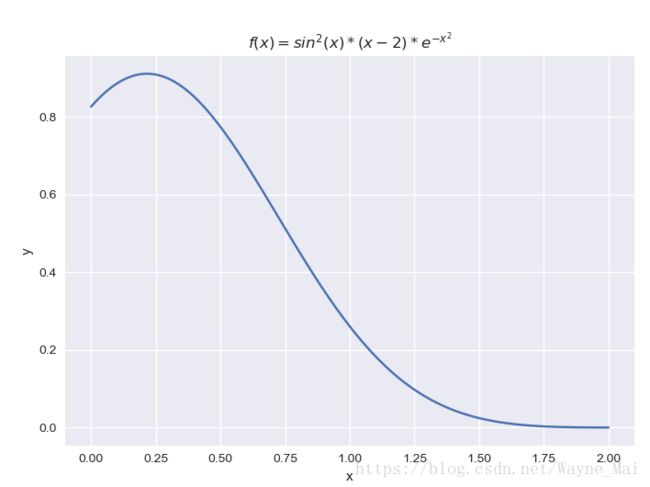
这个十分简单, plot霸王硬上弓即可.
"""Exercise 11.1: Plotting a function
Plot the function
f(x) = sin2(x − 2)e−x2
over the interval [0; 2]. Add proper axis labels, a title, etc."""

import matplotlib.pyplot as plt
import math
import numpy as np


def fun(x):
    return math.sin(x-2) ** 2 * math.exp(-x ** 2)


x = np.linspace(0, 2, num=1000)
plt.style.use('seaborn')
fun = np.vectorize(fun)
plt.plot(x, fun(x))
plt.xlabel('x')
plt.ylabel('y')
plt.title(r'$f(x)=sin^2(x)*(x-2)*e^{-x^2}$')
plt.show()
Exercise 11.2
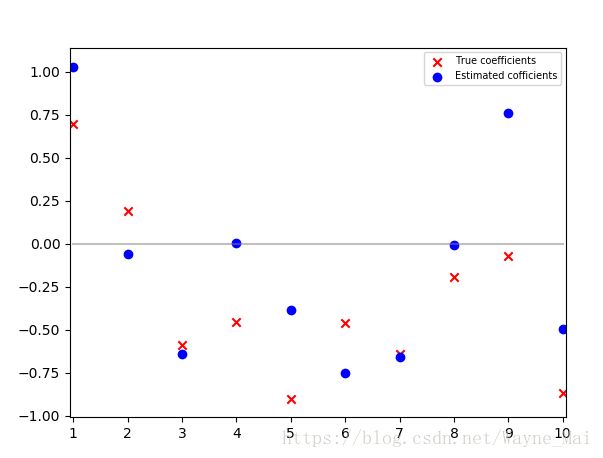
这里画散点图可以尝试利用marker参数来实现不同的标记.
关于算法方面, 这显然是个最小二乘. 我们用之前的正规方程求解.
"""Create a data matrix X with 20 observations of 10 variables. Generate a vector b with parameters Then
generate the response vector y = Xb+z where z is a vector with standard normally distributed variables.
Now (by only using y and X), find an estimator for b, by solving
^b = arg min
b
kXb − yk2
Plot the true parameters b and estimated parameters ^b. See Figure 1 for an example plot"""
import matplotlib.pyplot as plt
import math
import numpy as np

X = np.random.normal(0, 1, [20, 10])
b = np.random.normal(0, 1, 10)
z = np.random.normal(0, 1, 20)
y = np.matmul(X, b.reshape(-1, 1)) + z.reshape(-1, 1)

inverse = np.linalg.inv(np.matmul(np.transpose(X), X))
w = np.matmul(inverse, np.matmul(np.transpose(X), y))

x = np.linspace(1, 10, 10, endpoint=True)
plt.scatter(x, b, marker='x', color='r',label='True coefficients')
plt.scatter(x, w, marker='o', color='blue',label='Estimated cofficients')
plt.legend(loc=1, ncol=1, prop={'size': 7})
plt.plot(x, [0.0 for i in range(10)], color='gray', alpha=0.5)
plt.xticks(x)
plt.margins(x=0)
plt.show()
Exercise 11.3
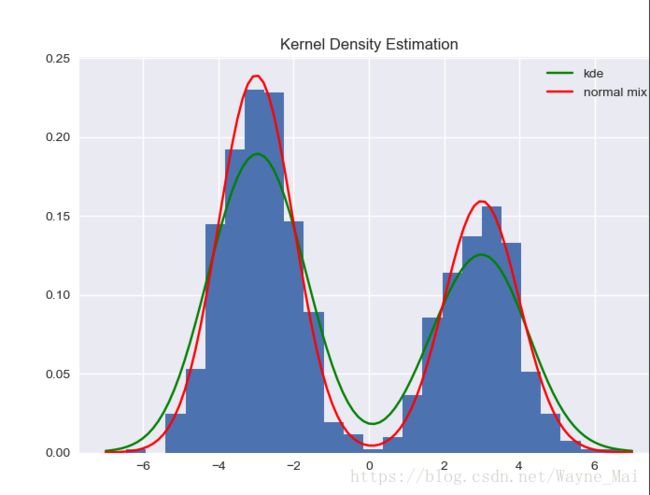
这里利用了Scipy的高斯核函数. 我们生成一个随机的一维双峰混合高斯分布, 再把高斯核估计的PDF(概率密度函数), 实际的概率密度函数都给画出来.
"""Generate a vector z of 10000 observations from your favorite exotic distribution. Then make a plot that
shows a histogram of z (with 25 bins), along with an estimate for the density, using a Gaussian kernel
density estimator (see scipy.stats). See Figure 2 for an example plot."""


import matplotlib.pyplot as plt
import numpy as np
from scipy import stats

n_basesample = 1000

alpha = 0.6  # weight for (prob of) lower distribution
mlow, mhigh = (-3.0, 3.0)  # mean locations for gaussian mixture
xn = np.concatenate([mlow + np.random.randn(int(alpha * n_basesample)),
                     mhigh + np.random.randn(int((1 - alpha) * n_basesample))])

# Generate core
gkde = stats.gaussian_kde(xn)

ind = np.linspace(-7, 7, 101)
kdepdf = gkde.evaluate(ind)

plt.style.use('seaborn')

# plot histgram of sample
plt.hist(xn, bins=25, density=1)

# plot estimated density
plt.plot(ind, kdepdf, label='kde', color="g")

# plot data generating density
plt.plot(ind, alpha * stats.norm.pdf(ind, loc=mlow) +
         (1 - alpha) * stats.norm.pdf(ind, loc=mhigh),
         color="r", label='normal mix')

plt.title('Kernel Density Estimation')
plt.legend()
plt.xticks()
plt.show()
参考资料
- Using the Gaussian Kernel Density Estimation


