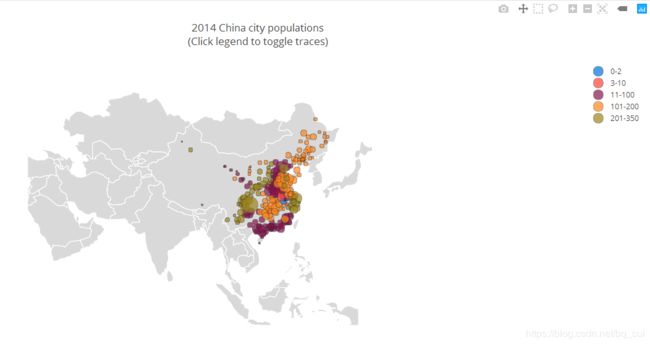
python笔记:5.3.19_基本统计图形_数据地图
这个plotly实现的数据地图比较不爽的是,完成后数据自动上传,并需要在浏览器中才能看。
# -*- coding: utf-8 -*-
"""
Created on Mon Jun 10 14:04:49 2019

@author: User
"""

import plotly as pl
import plotly.plotly as py
import numpy as np
import pandas as pd

pl.tools.set_credentials_file(username='***',api_key='***')

df=pd.read_csv(u'data\\ch5\chinacitypop.csv',encoding = "gbk")
print(df.info())

df['text']=df['name'] + '
Population'+(df['pop']).astype(str)+' ten thousand'
limits=[(0,2),(3,10),(11,100),(101,200),(201,350)]
colors=['rgb(0,116,217)',
        'rgb(255,65,54)',
        'rgb(133,20,75)',
        'rgb(255,133,27)',
        'rgb(155,133,27)']
cities=[]
scale=10

for i in range(len(limits)):
    lim=limits[i]
    df_sub=df[lim[0]:lim[1]]
    city=dict(type='scattergeo',locationmode='USA-states',lon=df_sub['lon'],
              lat=df_sub['lat'],text=df_sub['text'],
              marker=dict(size=df_sub['pop']/scale,color=colors[i],
                          line=dict(width=0.5,color='rgb(40,40,40)'),
                          sizemode='area'),name='{0}-{1}'.format(lim[0],lim[1]))
    cities.append(city)

layout=dict(title='2014 China city populations
(Click legend to toggle traces)',
            showlegend=True,
            geo=dict(scope='asia',projection=dict(type='mercator'),
                     showland=True,
                     landcolor='rgb(217,217,217)',subunitwidth=1,
                     countrywidth=1,
                     subunitcolor='rgb(255,255,255)',
                     countrycolor='rgb(255,255,255)'),)

fig=dict(data=cities,layout=layout)
py.iplot(fig,filename='d3-bubble-map-chn-populations')
运行:
