How to Tune Your HBase Cluster 怎样对hbase进行内存调优
from: https://blogs.apache.org/hbase/entry/tuning_g1gc_for_your_hbase
Tuning G1GC For Your HBase Cluster
Graham Baecher is a Senior Software Engineer on HubSpot's infrastructure team and Eric Abbott is a Staff Software Engineer at HubSpot.
An earlier version of this post was published here on the HubSpot Product and Engineering blog.
Tuning G1GC For Your HBase Cluster
HBase is the big data store of choice for engineering at HubSpot. It’s a complicated data store with a multitude of levers and knobs that can be adjusted to tune performance. We’ve put a lot of effort into optimizing the performance and stability of our HBase clusters, and recently discovered that suboptimal G1GC tuning was playing a big part in issues we were seeing, especially with stability.
Each of our HBase clusters is made up of 6 to 40 AWS d2.8xlarge instances serving terabytes of data. Individual instances handle sustained loads over 50k ops/sec with peaks well beyond that. This post will cover the efforts undertaken to iron out G1GC-related performance issues in these clusters. If you haven't already, we suggest getting familiar with the characteristics, quirks, and terminology of G1GC first.
We first discovered that G1GC might be a source of pain while investigating frequent
“...FSHLog: Slow sync cost: ### ms...”
messages in our RegionServer logs. Their occurrence correlated very closely to GC pauses, so we dug further into RegionServer GC. We discovered three issues related to GC:
- One cluster was losing nodes regularly due to long GC pauses.
- The overall GC time was between 15-25% during peak hours.
- Individual GC events were frequently above 500ms, with many over 1s.
Below are the 7 tuning iterations we tried in order to solve these issues, and how each one played out. As a result, we developed a step-by-step summary for tuning HBase clusters.
Original GC Tuning State
The original JVM tuning was based on an Intel blog post, and over time morphed into the following configuration just prior to our major tuning effort.
-Xmx32g -Xms32g
32 GB heap, initial and max should be the same
-XX:G1NewSizePercent= 3-9
Minimum size for Eden each epoch, differs by cluster
-XX:MaxGCPauseMillis=50
Optimistic target, most clusters take 100+ ms
-XX:-OmitStackTraceInFastThrow
Better stack traces in some circumstances, traded for a bit more CPU usage
-XX:+ParallelRefProcEnabled
Helps keep a lid on reference processing time issues were were seeing
-XX:+PerfDisableSharedMem
Alleged to protect against a bizarre Linux issue
-XX:-ResizePLAB
Alleged to save some CPU cycles in between GC epochs
GC logging verbosity as shown below was cranked up to a high enough level of detail for our homegrown gc_log_visualizer script. The majority of graphs in this document were created with gc_log_visualizer, while others were snapshotted from SignalFX data collected through our CollectD GC metrics plugin.
Our GC logging params:
-verbosegc
-XX:+PrintGC
-XX:+PrintGCDateStamps
-XX:+PrintAdaptiveSizePolicy
-XX:+PrintGCDetails
-XX:+PrintGCApplicationStoppedTime
-XX:+PrintTenuringDistribution
Starting Point: Heap Sizes and Overall Time Spent in GC
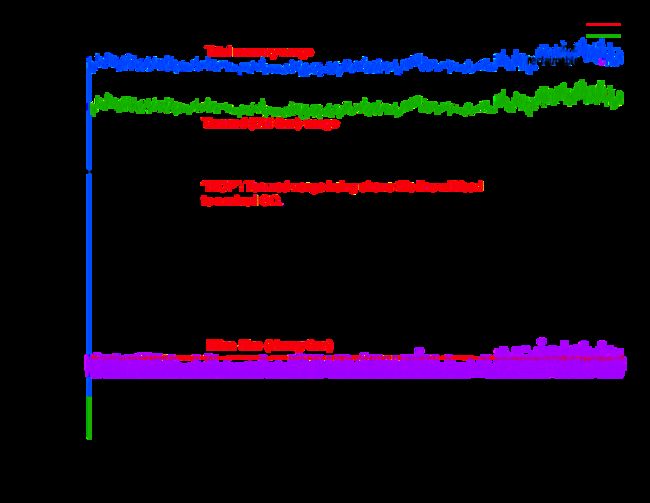
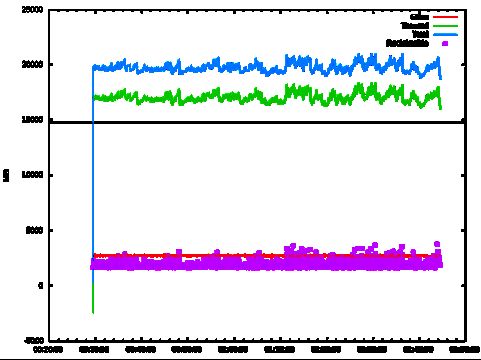
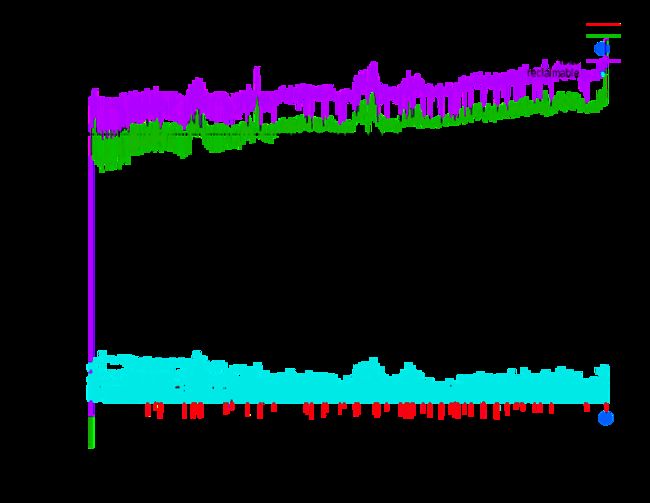
With the highly detailed GC logs came the following chart of heap state. Eden size is in red and stays put at its minimum (G1NewSizePercent), 9% of total heap. Tenured size, or Working set + waste, floats in a narrow band between 18-20gb. With Eden a flat line, the total heap line will mirror the Tenured line, just 9% higher.
The black horizontal line just under 15GB marks the InitiatingHeapOccupancyPercent (aka “IHOP”), at its default setting of 45%. The purple squares are the amount of Tenured space reclaimable at the start of a mixed GC event. The floor of the band of purple squares is 5% of heap, the value of G1HeapWastePercent.
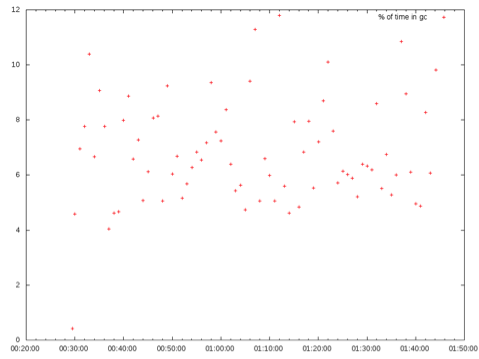
The next graph shows a red “+” on each minute boundary and stands for the total percent of wall time the JVM was in STW and doing no useful work. The overall time spent in GC for this HBase instance for this time period is 15-25%. For reference, an application tier server spending 20%+ time in GC is considered stuck in “GC Hell” and in desperate need of tuning.
Tuning #1 Goal: Lower Total Time in GC - Action: Raise IHOP
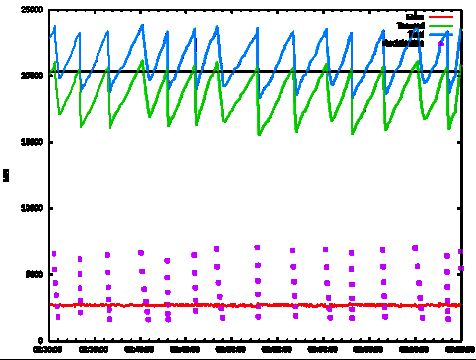
One aspect that stands out clearly in the previous graph of heap sizes is that the working set is well above the IHOP. Tenured being higher than IHOP generally results in an overabundance of MPCMC runs (wastes CPU) and consequently an overabundance of Mixed GC cycles resulting in a higher ratio of expensive GC events vs cheap GC events. By moving IHOP a bit higher than Tenured, we expect fewer Mixed GC events to reclaim larger amounts of space, which should translate to less overall time spent in STW.
Raising the IHOP value on an HBase instance, the following before/after (above/below) graphs show that indeed the frequency of Mixed GC events drops dramatically while the reclaimable amount rises.
Considering that at least half of Mixed GC events on this instance took 200-400ms, we expected the reduced amount of Mixed GC events to outweigh any increase in individual Mixed GC times, such that overall GC time would drop. That expectation held true, as overall time spent in GC dropped from 4-12% to 1-8%.
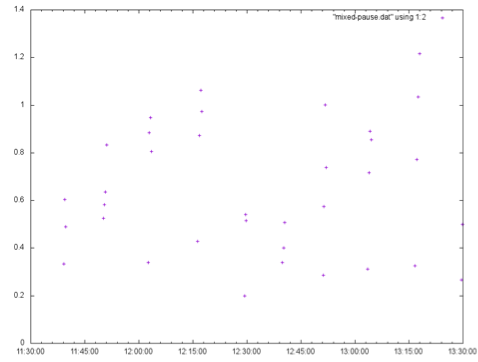
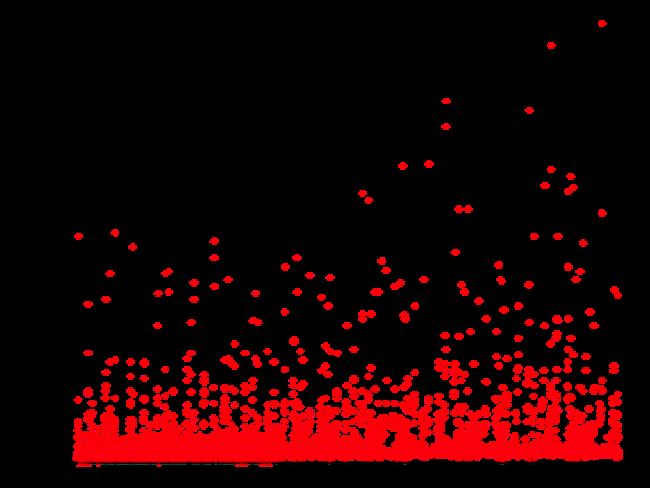
The following graphs show before/after on the STW times for all Mixed GC events. Note the drastic drop in frequency while individual STW times don't seem to change.
Result: Success
This test was considered successful. We made the change across all HBase clusters to use a significantly larger IHOP value than the default of 45%.
Tuning #2 Goal: Lower Total Time in GC - Action: Increase Eden
Fixing the IHOP value to be higher than working set was basically fixing a misconfiguration. There was very little doubt that nonstop MPCMC + Mixed GC events was an inefficient behavior. Increasing Eden size, on the other hand, had a real possibility of increasing all STW times, both Minor and Mixed. GC times are driven by the amount of data being copied (surviving) from one epoch to the next, and databases like HBase are expected to have very large caches. A 10+ GB cache could very well have high churn and thus high object survival rates.
The effective Eden size for our HBase clusters is driven by the minimum Eden value G1NewSizePercent because the MaxGCPauseMillis target of 50ms is never met.
For this test, we raised Eden from 9% to 20% through G1NewSizePercent.
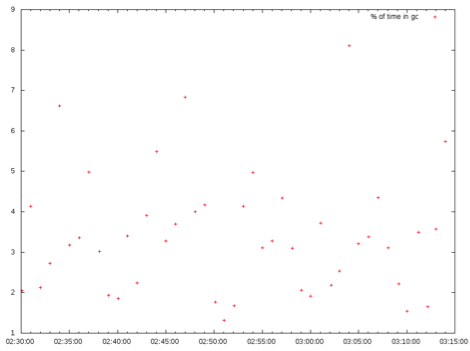
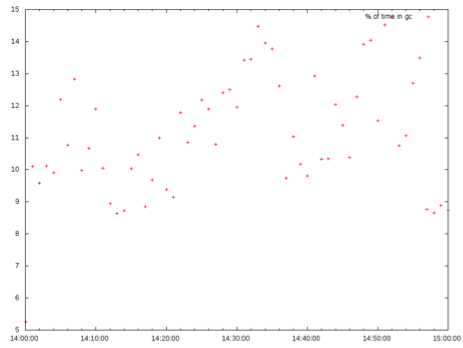
Effects on Overall GC Time
Looking at the following graphs, we see that overall time spent in GC may have dropped a little for this one hour time window from one day to the next.
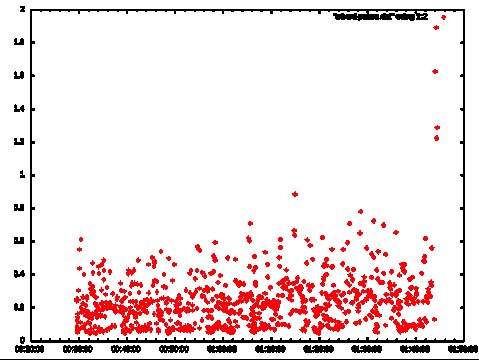
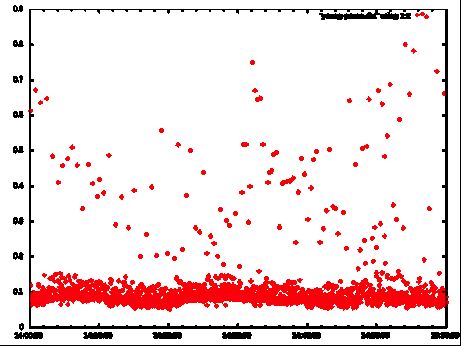
Individual STW times
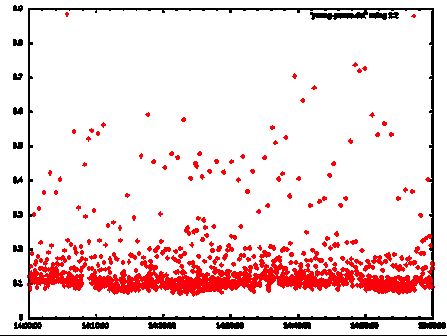
Looking at the STW times for just the Minor GC events there is a noticeable jump in the floor of STW times.
To-space Exhaustion Danger
As mentioned in the G1GC Foundational blog post, G1ReservePercent is ignored when the minimum end of the Eden range is used. The working set on a few of our HBase clusters is in the 70-75% range, which combined with a min Eden of 20% would leave only 5-10% of heap free for emergency circumstances. The downside of running out of free space, thus triggering To-space Exhaustion, is a 20+ sec GC pause and the effective death of the HBase instance. While the instance would recover, the other HBase instances in the cluster would consider it long dead before the GC pause completed.
Result: FailureThe overall time spent in GC did drop a little as theoretically expected, unfortunately the low end of Minor GC stop the world times increased by a similar percent. In addition, the risk for To-space exhaustion increased. The approach of increasing G1NewSizePercent to reduce overall time spent in GC didn't look promising and was not rolled out to any clusters.
Tuning #3 Goal: Reduce Individual STW Durations - Action: SurvivorRatio and MaxTenuringThreshold
In the previous tuning approach, we found that STW times increased as Eden size increased. We took some time to dig a little deeper into Survivor space to determine if there was any To-space overflow or if objects could be promoted faster to reduce the amount of object copying being done. To collect the Survivor space tenuring distribution data in the GC logs we enabled PrintTenuringDistribution and restarted a few select instances.
To-space overflow is the phenomenon where the Survivor To space isn't large enough to fit all the live data in Eden at the end of an epoch. Any data collected after Survivor To is full is added to Free regions, which are then added to Tenured. If this overflow is transient data, putting it in Tenured is inefficient as it will be expensive to clean out. If that was the case, we'd need to increase SurvivorRatio.
On the other hand, consider a use case where any object that survives two epochs will also survive ten epochs. In that case, by ensuring that any object that survives a second epoch is immediately promoted to Tenured, we would see a performance improvement since we wouldn’t be copying it around in the GC events that followed.
Here’s some data collected from the PrintTenuringDistribution parameter:
Desired survivor size 192937984 bytes, new threshold 2 (max 15)
- age 1: 152368032 bytes, 152368032 total
- age 2: 147385840 bytes, 299753872 total
[Eden: 2656.0M(2656.0M)->0.0B(2624.0M) Survivors: 288.0M->320.0M Heap: 25.5G(32.0G)->23.1G(32.0G)]
An Eden size of 2656 MB with SurvivorRatio = 8 (default) yields a 2656/8 = 332 MB survivor space. In the example entries we see enough room to hold two ages of survivor objects. The second age here is 5mb smaller than the first age, indicating that in the interval between GC events, only 5/152 = 3.3% of the data was transient. We can reasonably assume the other 97% of the data is some kind of caching. By setting MaxTenuringThreshold = 1, we optimize for the 97% of cached data to be promoted to Tenured after surviving its second epoch and hopefully shave a few ms of object copy time off each GC event.
Result: Theoretical SuccessUnfortunately we don't have any nice graphs available to show these effects in isolation. We consider the theory sound and rolled out MaxTenuringThreshold = 1 to all our clusters.
Tuning #4 Goal: Eliminate Long STW Events - Action: G1MixedGCCountTarget & G1HeapWastePercent
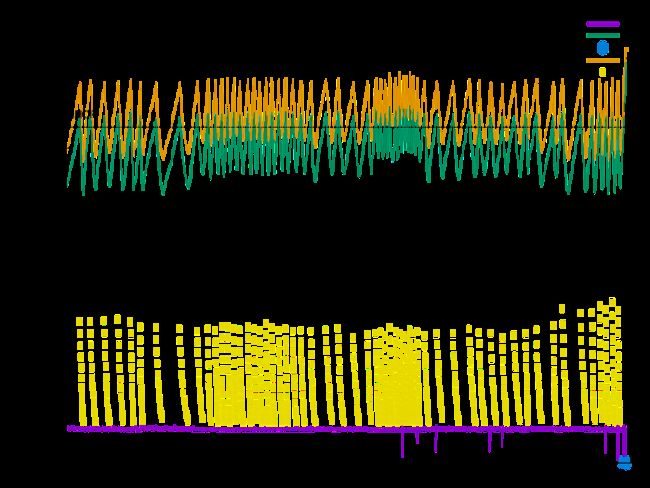
Next, we wanted to see what we could do about eliminating the high end of Mixed GC pauses. Looking at a 5 minute interval of our Mixed GC STW times, we saw a pattern of sharply increasing pauses across each cycle of 6 mixed GCs:
That in and of itself should not be considered unusual, after all that behavior is how the G1GC algorithm got it's name. Each Mixed GC event will evacuate 1 / G1MixedGCCountTarget of the high-waste regions (regions with the most non-live data). Since it prioritizes regions with the most garbage, each successive Mixed GC event will be evicting regions with more and more live objects. The chart shows the performance effects of clearing out regions with more and more live data: the Mixed event times start at 100ms at the beginning of a mixed GC cycle and range upwards past 600ms by the end.
In our case, we were seeing occasional pauses at the end of some cycles that were several seconds long. Even though they were rare enough that our average pause time was reasonable, pauses that long are still a serious concern.
Two levers in combination can be used together to lessen the “scraping the bottom of the barrel” effect of cleaning up regions with a lot of live data:
G1HeapWastePercent: default (5) → 10. Allow twice as much wasted space in Tenured. Having 5% waste resulted in 6 of the 8 potential Mixed GC events occurring in each Mixed GC cycle. Bumping to 10% waste should chop off 1-2 more of the most expensive events of the Mixed GC cycle.
G1MixedGCCountTarget: default (8) → 16. Double the target number of Mixed GC events each Mixed GC cycle, but halve the work done by each GC event. Though it’s an increase to the number of GC events that are Mixed GC events, STW times of individual Mixed events should drop noticeably.
In combination, we expected doubling the target count to drop the average Mixed GC time, and increasing the allowable waste to eliminate the most expensive Mixed GC time. There should be some synergy, as more heap waste should also mean regions are on average slightly less live when collected.
Waste heap values of 10% and 15% were both examined in a test environment. (Don’t be alarmed by the high average pause times - this test environment was running under heavy load, on less capable hardware than our production servers.)
Above: 10% heap waste; below: 15% heap waste:
The results are very similar. 15% performed slightly better, but in the end we decided that 15% waste was unnecessarily much. 10% was enough to clear out the "scraping the bottom of the barrel" effect such that the 1+ sec Mixed GC STW times all but disappeared in production.
Result: SuccessDoubling G1MixedGCCountTarget from 8 to 16 and G1HeapWastePercent from 5 to 10 succeeded in eliminating the frequent 1s+ Mixed GC STW times. We kept these changes and rolled them out across all our clusters.
Tuning #5 Goal: Stop Losing Nodes: Heap Size and HBase Configs
While running load tests to gauge the effects of the parameters above, we also began to dig into what looked like evidence of memory leaks in a production cluster. In the following graph we see the heap usage slowly grow over time until To-space Exhaustion, triggering a Full GC with a long enough pause to get the HBase instance booted from the cluster and killed:
We've got several HBase clusters, and only one cluster occasionally showed this type of behavior. If this issue were a memory leak, we'd expect the issue to arise more broadly, so it looks like HBase is using more memory in this cluster than we expected. To understand why, we looked into the heap breakdown of our RegionServers. The vast majority of an HBase RegionServer’s Tenured space is allocated to three main areas:
Memstore: region server’s write cache; default configuration caps this at 40% of heap. Block Cache: region server’s read cache; default config caps at 40% of heap. Overhead: the vast majority of HBase’s in-memory overhead is contained in a “static index”. The size of this index isn’t capped or configurable, but HBase assumes this won’t be an issue since the combined cap for memstore and block cache can’t exceed 80%.
We have metrics for the size of each of these, from the RegionServer’s JMX stats: “memStoreSize,” “blockCacheSize,” and “staticIndexSize.” The stats from our clusters show that HBase will use basically all of the block cache capacity you give it, but memstore and static index sizes depend on cluster usage and tables. Memstore fluctuates over time, while static index size depends on the RegionServer’s StoreFile count and average row key size.
It turned out, for the cluster in question, that the HBase caches and overhead combined were actually using more space than our JVM was tuned to handle. Not only were memstore and block cache close to capacity—12 GB block cache, memstore rising past 10GB - but the static index size was unexpectedly large, at 6 GB. Combined, this put desired Tenured space at 28+ GB, while our IHOP was set at 24 GB, so the upward trend of our Tenured space was just the legitimate memory usage of the RegionServer.
With this in mind, we judged the maximum expected heap use for each cluster’s RegionServers by looking at the cluster maximum memstore size, block cache size, and static index size over the previous month, and assuming max expected usage to be 110% of each value. We then used that number to set the block cache and memstore size caps (hfile.block.cache.size and hbase.regionserver.global.memstore.size) in our HBase configs.
The fourth component of Tenured space is the heap waste, in our case 10% of the heap size. We could now confidently tune our IHOP threshold by summing the max expected memstore, block cache, static index size, 10% heap for heap waste, and finally 10% more heap as a buffer to avoid constant mixed GCs when working set is maxed (as described in Tuning #1).
However, before we went ahead and blindly set this value, we had to consider the uses of heap other than Tenured space. Eden requires a certain amount of heap (determined by G1NewSizePercent), and a certain amount (default 10%) is Reserved free space. IHOP + Eden + Reserved must be ≤ 100% in order for a tuning to make sense; in cases where our now-precisely-calculated IHOP was too large for this to be possible, we had to expand our RegionServer heaps. To determine minimum acceptable heap size, assuming 10% Reserved space, we used this formula:
Heap ≥ (M + B + O + E) ÷ 0.7
-
- M = max expected memstore size
- B = max expected block cache size
- O = max expected overhead (static index)
- E = minimum Eden size
When those four components add up to ≤ 70% of the heap, then there will be enough room for 10% Reserved space, 10% heap waste, and 10% buffer between max working set and IHOP.
Result: SuccessWe reviewed memory usage of each of our clusters and calculated correct heap sizes and IHOP thresholds for each. Rolling out these changes immediately ended the To-space Exhaustion events we were seeing on the problematic cluster.
Tuning #6 Goal: Eliminate Long STW Events - Action: Increase G1 Region Size
We’d rolled out HBase block cache & memstore config changes, changes to G1HeapWastePercent and G1MixedGCCountTarget, and an increase in heap size on a couple clusters (32 GB → 40+ GB) to accommodate larger IHOP. In general things were smooth, but there were still occasional Mixed GC events taking longer than we were comfortable with, especially on the clusters whose heap had increased. Using gc_log_visualizer, we looked into what phase of Mixed GC was the most volatile and noticed that Scan RS times correlated:
A few Google searches indicated that Scan RS time output in the GC logs is the time taken examining all the regions referencing the tenured regions being collected. In our most recent tuning changes, heap size had been bumped up, however the G1HeapRegionSize remained fixed at 16 MB. Increasing the G1HeapRegionSize to 32 MB eliminated those high scan times:
Result: Success
Halving the G1 region count cleared out the high volatility in Scan RS times. According to G1GC documentation, the ideal region count is 2048, so 16 MB regions were perfect for a 32 GB heap. However, this tuning case led us to believe that for HBase heaps without a clear choice of region size, in our case 40+ GB, it’s much better to err on the side of fewer, larger regions.
Tuning #7 Goal: Preventing RegionServer To-space Exhaustion - Action: Extra Heap as Buffer
At this point, our RegionServers were tuned and running much shorter and less frequent GC Events. IHOP rested above Tenured while Tenured + Eden remained under the target of 90% total heap. Yet once in awhile, a RegionServer would still die from a To-space exhaustion triggered Full GC event as shown in the following graph.
It looks like we did everything right—there’s lot’s of reclaimable space and Tenured space drops well below IHOP with each Mixed GC. But right at the end, heap usage spikes up and we hit To-space Exhaustion. And while it’s likely the HBase client whose requests caused this problem could be improved to avoid this*, we can’t rely on our various HBase clients to behave perfectly all the time.
In the scenario above, very bursty traffic caused Tenured space to fill up the heap before the MPCMC could complete and enable a Mixed GC run. To tune around this, we simply added heap space**, while adjusting IHOP and G1NewSizePercent down to keep them at the same GB values they had been at before. By doing this we increased the buffer of free space in the heap above our original 10% default, for additional protection against spikes in memory usage.
Result: SuccessIncreasing heap buffer space on clusters whose HBase clients are known to be occasionally bursty has all but eliminated Full GC events on our RegionServers.
Notes:
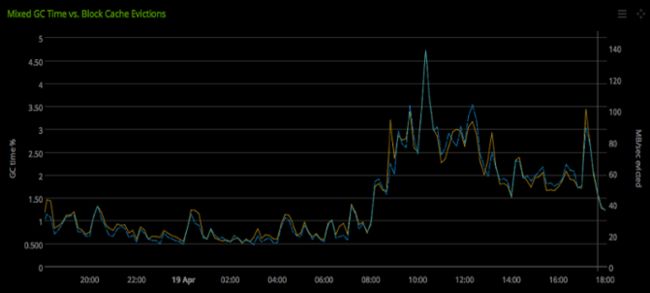
* Block cache churn correlates very closely with time spent in Mixed GC events on our clusters (see chart below). A high volume of Get and Scan requests with caching enabled unnecessarily (e.g. requested data isn’t expected to be in cache and isn’t expected to be requested again soon) will increase cache churn as data is evicted from cache to make room for the Get/Scan results. This will raise the RegionServer’s time in GC and could contribute to instability as described in this section.
Chart: % time in Mixed GC is in yellow (left axis); MB/sec cache churn is in blue (right axis):
** ** Another potential way to tune around this issue is by increasing ConcGCThreads (default is 1/4 * ParallelGCThreads). ConcGCThreads is the number of threads used to do the MPCMC, so increasing it could mean the MPCMC finishes sooner and the RegionServer can start a Mixed GC before Tenured space fills the heap. At HubSpot we’ve been satisfied with the results of increasing our heap size and haven’t tried experimenting with this value.
Overall Results: Goals Achieved!
After these cycles of debugging and tuning G1GC for our HBase clusters, we’ve improved performance in all the areas we were seeing problems originally:
Stability: no more To-space Exhaustion events causing Full GCs. 99th percentile performance: greatly reduced frequency of long STW times. Avg. performance: overall time spent in GC STW significantly reduced.
Summary: How to Tune Your HBase Cluster
Based on our findings, here’s how we recommend you tune G1GC for your HBase cluster(s):
Before you start: GC and HBase monitoring
- Track block cache, memstore and static index size metrics for your clusters in whatever tool you use for charts and monitoring, if you don’t already. These are found in the RegionServer JMX metrics:
- “memStoreSize”
- “blockCacheSize”
- “staticIndexSize”
- You can use our collectd plugin to track G1GC performance over time, and our gc_log_visualizer for insight on specific GC logs. In order to use these you’ll have to log GC details on your RegionServers:
- -Xloggc:$GC_LOG_PATH
- -verbosegc
- -XX:+PrintGC
- -XX:+PrintGCDateStamps
- -XX:+PrintAdaptiveSizePolicy
- -XX:+PrintGCDetails
- -XX:+PrintGCApplicationStoppedTime
- -XX:+PrintTenuringDistribution
- Also recommended is some kind of GC log rotation, e.g.:
- -XX:+UseGCLogFileRotation
- -XX:NumberOfGCLogFiles = 5
- -XX:GCLogFileSize=20M
Step 0: Recommended Defaults
- We recommend the following JVM parameters and values as defaults for your HBase RegionServers (as explained in Original GC Tuning State):
- -XX:+UseG1GC
- -XX:+UnlockExperimentalVMOptions
- -XX:MaxGCPauseMillis = 50
- This value is intentionally very low and doesn’t actually represent a pause time upper bound. We recommend keeping it low to pin Eden to the low end of its range (see Tuning #2).
- -XX:-OmitStackTraceInFastThrow
- -XX:ParallelGCThreads = 8+(logical processors-8)(5/8)
- -XX:+ParallelRefProcEnabled
- -XX:+PerfDisableSharedMem
- -XX:-ResizePLAB
Step 1: Determine maximum expected HBase usage
- As discussed in the Tuning #5 section, before you can properly tune your cluster you need to know your max expected block cache, memstore, and static index usage.
- Using the RegionServer JMX metrics mentioned above, look for the maximum value of each metric across the cluster:
- Maximum block cache size.
- Maximum memstore size.
- Maximum static index size.
- Scale each maximum by 110%, to accommodate even for slight increase in max usage. This is your usage cap for that metric: e.g. a 10 GB max recorded memstore → 11 GB memstore cap.
- Ideally, you’ll have these metrics tracked for the past week or month, and you can find the maximum values over that time. If not, be more generous than 110% when calculating memstore and static index caps. Memstore size especially can vary widely over time.
- Using the RegionServer JMX metrics mentioned above, look for the maximum value of each metric across the cluster:
Step 2: Set Heap size, IHOP, and Eden size
- Start with Eden size relatively low: 8% of heap is a good initial value if you’re not sure.
- -XX:G1NewSizePercent = 8
- See Tuning #2 for more about Eden sizing.
- Increasing Eden size will increase individual GC pauses, but slightly reduce overall % time spent in GC.
- Decreasing Eden size will have the opposite effect: shorter pauses, slightly more overall time in GC.
- Determine necessary heap size, using Eden size and usage caps from Step 1:
- From Tuning #5: Heap ≥ (M + B + O + E) ÷ 0.7
- M = memstore cap, GB
- B = block cache cap, GB
- O = static index cap, GB
- E = Eden size, GB
- Set JVM args for fixed heap size based on the calculated value, e.g:
- -Xms40960m -Xmx40960m
- -Xms40960m -Xmx40960m
- From Tuning #5: Heap ≥ (M + B + O + E) ÷ 0.7
- Set IHOP in the JVM, based on usage caps and heap size:
- IHOP = (memstore cap’s % heap + block cache cap’s % heap + overhead cap’s % heap + 20)
- -XX:InitiatingHeapOccupancyPercent = IHOP
Step 3: Adjust HBase configs based on usage caps
- Set block cache cap and memstore cap ratios in HBase configs, based on usage caps and total heap size. In hbase-site.xml:
- hfile.block.cache.size → block cache cap ÷ heap size
- hbase.regionserver.global.memstore.size → memstore cap ÷ heap size
Step 4: Adjust additional recommended JVM flags for GC performance
- From Tuning #3:
- -XX:MaxTenuringThreshold = 1
- -XX:MaxTenuringThreshold = 1
- From Tuning #4:
- -XX:G1HeapWastePercent = 10
- -XX:G1MixedGCCountTarget = 16
- From Tuning #6:
- -XX:G1HeapRegionSize = #M
- # must be a power of 2, in range [1..32].
- Ideally, # is such that: heap size ÷ # MB = 2048 regions.
- If your heap size doesn’t provide a clear choice for region size, err on the side of fewer, larger regions. Larger regions reduce GC pause time volatility.
Step 5: Run it!
- Restart your RegionServers with these settings and see how they look.
- Remember that you can adjust Eden size as described above, to optimize either for shorter individual GCs or for less overall time in GC. If you do, make sure to maintain Eden + IHOP ≤ 90%.
- If your HBase clients can have very bursty traffic, consider adding heap space outside of IHOP and Eden (so that IHOP + Eden adds up to 80%, for example).
- Remember to update % and ratio configs along with the new heap size.
- Details and further suggestions about this found in Tuning #7.
- Remember to update % and ratio configs along with the new heap size.
- Remember that you can adjust Eden size as described above, to optimize either for shorter individual GCs or for less overall time in GC. If you do, make sure to maintain Eden + IHOP ≤ 90%.
Further reference:
- G1GC Fundamentals (HubSpot blog)
- Understanding G1GC Logs (Oracle blog)
- Tuning HBase Garbage Collection (Intel blog)
