BlockCanary 源码分析
BlockCanary 源码分析
- 一、概述
- 二、实现原理
- 三、源码分析
- 1. 初始化流程
- 2. 堆栈信息采集过程
- 3. CPU信息采集过程
- 四、小结
一、概述
在 Android 开发过程中,经常会遇到 UI 卡顿的问题,那怎么去监测 UI 的卡顿呢?今天我们就来分析一款监测 UI 卡顿的框架:BlockCanary。题外话:滴滴的 DoraemonKit 开发辅助框架提供的卡顿监测原理与 BlockCanary 一致。
BlockCanary 是一个轻量的,非侵入式的性能监控组件,目前采集了 UI 卡顿相关的 线程堆栈信息 和CPU 使用信息,用于分析定位问题。
参考:
- BlockCanary :Github 传送门 https://github.com/markzhai/AndroidPerformanceMonitor
- DoraemonKit:Github 传送门 https://github.com/didi/DoraemonKit
- 作者:BlockCanary — 轻松找出Android App界面卡顿元凶
二、实现原理
在Android中,应用的卡顿主要是因为主线程执行了耗时操作导致的。
原理:
在 Looper 中有一个
Looper.loop()方法,一般耗时方法发生在msg.target.dispatchMessage(msg)中,所以我们可以利用 两次日志打印的时间差是否大于约定的时间值 来判断是否有耗时操作。
Looper.loop()
// Looper.class
public static void loop() {
 	// ...省略代码...
    for (;;) {
		// ...省略代码...
		// 1.处理消息事件前打印日志
        final Printer logging = me.mLogging;
        if (logging != null) {
            logging.println(">>>>> Dispatching to " + msg.target + " " + msg.callback + ": " + msg.what);
        }
        // ...省略代码...

        // 2.处理消息事件
        msg.target.dispatchMessage(msg);

        // ...省略代码...
        // 3.处理消息事件之后打印日志
        if (logging != null) {
            logging.println("<<<<< Finished to " + msg.target + " " + msg.callback);
        }
        // ...省略代码...
    }
}
三、源码分析
1. 初始化流程
使用方法:
public class App extends Application {
    @Override
    public void onCreate() {
        super.onCreate();
        // 初始化 BlockCanary,传入的 BlockCanaryContext 是一些配置参数信息。
        BlockCanary.install(this, new BlockCanaryContext()).start();
    }
}
下面分 install() 和 start() 两部分来分析一下。
BlockCanary.install()
// BlockCanary.class
public static BlockCanary install(Context context, BlockCanaryContext blockCanaryContext) {
	// 下面两步主要是进行一些赋值操作,如果有卡顿会展示在 DisplayActivity 这个页面。
    BlockCanaryContext.init(context, blockCanaryContext);
    setEnabled(context, DisplayActivity.class, BlockCanaryContext.get().displayNotification());

    // 重点:这里会创建一个BlockCanary实例对象。
    return get();
}

public static BlockCanary get() {
    if (sInstance == null) {
        synchronized (BlockCanary.class) {
            if (sInstance == null) {
                sInstance = new BlockCanary();
            }
        }
    }
    return sInstance;
}

private BlockCanary() {
	// 将Application中初始化时配置的 BlockCanaryContext 设置到 BlockCanaryInternals 中。
    BlockCanaryInternals.setContext(BlockCanaryContext.get());
    // 这里会初始化 BlockCanaryInternals 实例,真正给 Looper 设置 Printer 的逻辑就这这里
    mBlockCanaryCore = BlockCanaryInternals.getInstance();

    // 下面这两个就是设置两个回调函数。
    mBlockCanaryCore.addBlockInterceptor(BlockCanaryContext.get());
    if (!BlockCanaryContext.get().displayNotification()) {
        return;
    }
    mBlockCanaryCore.addBlockInterceptor(new DisplayService());
}
小结:
- BlockCanary 只是一个门面类,真正处理逻辑的是 BlockCanaryInternals 。
BlockCanaryInternals
static BlockCanaryInternals getInstance() {
    if (sInstance == null) {
        synchronized (BlockCanaryInternals.class) {
            if (sInstance == null) {
                sInstance = new BlockCanaryInternals();
            }
        }
    }
    return sInstance;
}

public BlockCanaryInternals() {
	// 1.设置了主线程的Looper,所以采集的是主线程的堆栈信息。
    stackSampler = new StackSampler(Looper.getMainLooper().getThread(), sContext.provideDumpInterval());
    // 2.采集CPU的使用信息。
    cpuSampler = new CpuSampler(sContext.provideDumpInterval());
	// 3.创建一个Printer对象。
    setMonitor(new LooperMonitor(new LooperMonitor.BlockListener() {

        @Override
        public void onBlockEvent(long realTimeStart, long realTimeEnd,
                                 long threadTimeStart, long threadTimeEnd) {
            // 4.如果主线程出现了卡顿,就会触发 onBlockEvent 回调方法,然后进行线程堆栈信息和cpu信息的采集。
            // Get recent thread-stack entries and cpu usage
            ArrayList<String> threadStackEntries = stackSampler.getThreadStackEntries(realTimeStart, realTimeEnd);
            if (!threadStackEntries.isEmpty()) {
                BlockInfo blockInfo = BlockInfo.newInstance()
                        .setMainThreadTimeCost(realTimeStart, realTimeEnd, threadTimeStart, threadTimeEnd)
                        .setCpuBusyFlag(cpuSampler.isCpuBusy(realTimeStart, realTimeEnd))
                        .setRecentCpuRate(cpuSampler.getCpuRateInfo())
                        .setThreadStackEntries(threadStackEntries)
                        .flushString();
                // 5.写入文件中保存
                LogWriter.save(blockInfo.toString());
				// 6.然后触发外部的回调,因此外部就可以做一些自定义的操作。
                if (mInterceptorChain.size() != 0) {
                    for (BlockInterceptor interceptor : mInterceptorChain) {
                        interceptor.onBlock(getContext().provideContext(), blockInfo);
                    }
                }
            }
        }
    }, getContext().provideBlockThreshold(), getContext().stopWhenDebugging()));

    LogWriter.cleanObsolete();
}

private void setMonitor(LooperMonitor looperPrinter) {
    monitor = looperPrinter;
}
小结:
- 构建线程堆栈信息的采集类
StackSampler。- 构建 CPU 使用信息的采集类
CpuSampler。- 构建 Looper 内日志打印的类
LooperMonitor。- 如果主线程发生了卡顿,就会触发
LooperMonitor.onBlockEvent()方法。- 在
LooperMonitor.onBlockEvent()中获取指定时间范围内的堆栈信息和CPU信息,并写入日志文件。- 发生卡顿时,触发外部的回调,将采集到的数据提供给外部进行自定义的操作。
注意:
这里虽然创建了 Looper 的日志类 LooperMonitor,但是并不会触发里面日志打印的操作,因为还没有将 LooperMonitor 赋值给主线程的 Looper。
那什么时候进行的赋值操作呢?在 BlockCanary.start()方法中进行了赋值。
BlockCanary.start()
public void start() {
    if (!mMonitorStarted) {
        mMonitorStarted = true;
        // 将自定义的 Printer 赋值给主线程的 Looper。
        Looper.getMainLooper().setMessageLogging(mBlockCanaryCore.monitor);
    }
}
小结:
mBlockCanaryCore.monitor是在 BlockCanaryInternals 构造函数时初始化的。- 在调用
BlockCanary.start()时,将我们自定义的 Printer 赋值给主线程的 Looper。
下面我们来看一下 LooperMonitor 的具体实现。
LooperMonitor
public void println(String x) {
    if (mStopWhenDebugging && Debug.isDebuggerConnected()) {
        return;
    }
    if (!mPrintingStarted) {
        mStartTimestamp = System.currentTimeMillis();
        mStartThreadTimestamp = SystemClock.currentThreadTimeMillis();
        mPrintingStarted = true;
        startDump();
    } else {
        final long endTime = System.currentTimeMillis();
        mPrintingStarted = false;
        // 卡顿的核心判断:判断前后两次日志打印时间差是否大于给定的值。
        if (isBlock(endTime)) {
            notifyBlockEvent(endTime);
        }
        stopDump();
    }
}

private boolean isBlock(long endTime) {
    return endTime - mStartTimestamp > mBlockThresholdMillis;
}

private void notifyBlockEvent(final long endTime) {
    final long startTime = mStartTimestamp;
    final long startThreadTime = mStartThreadTimestamp;
    final long endThreadTime = SystemClock.currentThreadTimeMillis();
    HandlerThreadFactory.getWriteLogThreadHandler().post(new Runnable() {
        @Override
        public void run() {
        	// 这个回调方法在 BlockCanaryInternals 构造函数中。
            mBlockListener.onBlockEvent(startTime, endTime, startThreadTime, endThreadTime);
        }
    });
}

// 开启线程堆栈和CPU的信息采集
private void startDump() {
    if (null != BlockCanaryInternals.getInstance().stackSampler) {
        BlockCanaryInternals.getInstance().stackSampler.start();
    }

    if (null != BlockCanaryInternals.getInstance().cpuSampler) {
        BlockCanaryInternals.getInstance().cpuSampler.start();
    }
}

// 关闭线程堆栈和CPU的信息采集
private void stopDump() {
    if (null != BlockCanaryInternals.getInstance().stackSampler) {
        BlockCanaryInternals.getInstance().stackSampler.stop();
    }

    if (null != BlockCanaryInternals.getInstance().cpuSampler) {
        BlockCanaryInternals.getInstance().cpuSampler.stop();
    }
}
小结:
LooperMonitor.println()方法是在Looper.loop()会被触发,且消费一个事件会触发两个打印操作(事件消费前触发一次,事件消费后触发一次)。- 通过 mPrintingStarted 标记来区分消费事件前和消费事件后两次的日志打印。
- 判断前后两次日志打印时间差是否大于给定的值来判断主线程是否卡顿。
- 事件消费前的日志打印操作会开启线程堆栈和CPU的信息采集。
- 事件消费后的日志打印操作会关闭线程堆栈和CPU的信息采集。
初始化的操作到这里就已经结束了,下面分析一下堆栈信息的采集和CPU信息的采集。
2. 堆栈信息采集过程
在分析之前我们先来分析一下 StackSampler 的父类 AbstractSampler。
abstract class AbstractSampler {
    private static final int DEFAULT_SAMPLE_INTERVAL = 300;

	// 通过 CAS 类来判断,避免重复执行采集操作。
    protected AtomicBoolean mShouldSample = new AtomicBoolean(false);
    protected long mSampleInterval;

    private Runnable mRunnable = new Runnable() {
        @Override
        public void run() {
        	// 由子类在 doSample 中执行数据采集工作。
            doSample();

			// 只要 Runnable 没有关闭,就会每间隔 mSampleInterval 时间来执行采集任务。
            if (mShouldSample.get()) {
                HandlerThreadFactory.getTimerThreadHandler()
                        .postDelayed(mRunnable, mSampleInterval);
            }
        }
    };

    public AbstractSampler(long sampleInterval) {
        if (0 == sampleInterval) {
            sampleInterval = DEFAULT_SAMPLE_INTERVAL;
        }
        mSampleInterval = sampleInterval;
    }

    public void start() {
    	// 通过 CAS 类来确认当前是否有数据采集操作。
        if (mShouldSample.get()) {
            return;
        }
        mShouldSample.set(true);
		// 线程一直处理开始状态,所以采集任务其实就是往线程中添加 Runnable 任务。
        HandlerThreadFactory.getTimerThreadHandler().removeCallbacks(mRunnable);
        HandlerThreadFactory.getTimerThreadHandler().postDelayed(mRunnable,
                BlockCanaryInternals.getInstance().getSampleDelay());
    }

    public void stop() {
    	// 通过 CAS 类来确认当前是否有数据采集操作。
        if (!mShouldSample.get()) {
            return;
        }
        mShouldSample.set(false);
        HandlerThreadFactory.getTimerThreadHandler().removeCallbacks(mRunnable);
    }

    abstract void doSample();
}
小结:
- 执行任务采集功能是在子线程中执行的。
- 每间隔 mSampleInterval 时间,就会执行采集任务。
StackSampler
// LruCache算法,默认保留100条堆栈信息。
private static final LinkedHashMap<Long, String> sStackMap = new LinkedHashMap<>();

protected void doSample() {
    StringBuilder stringBuilder = new StringBuilder();

	// 1.通过 Thread.getStackTrace() 方法获取当前线程的堆栈信息
    for (StackTraceElement stackTraceElement : mCurrentThread.getStackTrace()) {
        stringBuilder
                .append(stackTraceElement.toString())
                .append(BlockInfo.SEPARATOR);
    }

    synchronized (sStackMap) {
    	// 2.采集的堆栈信息大于指定条数就移除最早的数据。
        if (sStackMap.size() == mMaxEntryCount && mMaxEntryCount > 0) {
            sStackMap.remove(sStackMap.keySet().iterator().next());
        }
        // 3.将当前采集时间作为Key进行存储,便于后面根据线程阻塞时间来进行堆栈数据的筛选。
        sStackMap.put(System.currentTimeMillis(), stringBuilder.toString());
    }
}

public ArrayList<String> getThreadStackEntries(long startTime, long endTime) {
    ArrayList<String> result = new ArrayList<>();
    synchronized (sStackMap) {
        for (Long entryTime : sStackMap.keySet()) {
        	// 采集主线程卡顿时间内的堆栈信息。
            if (startTime < entryTime && entryTime < endTime) {
                result.add(BlockInfo.TIME_FORMATTER.format(entryTime)
                        + BlockInfo.SEPARATOR
                        + BlockInfo.SEPARATOR
                        + sStackMap.get(entryTime));
            }
        }
    }
    return result;
}
小结:
数据采集过程:
- 通过 Thread.getStackTrace() 方法获取当前线程的堆栈信息。
- 采集的堆栈信息大于指定条数就移除最早的数据。
- 将当前采集时间作为Key进行存储,便于后面根据线程阻塞时间来进行堆栈数据的筛选。
数据过滤过程:
- 通过给定的线程阻塞的开始 / 结束时间来筛选采集到的堆栈信息。
3. CPU信息采集过程
// LruCache算法,默认保留10条堆栈信息。
private final LinkedHashMap<Long, String> mCpuInfoEntries = new LinkedHashMap<>();

protected void doSample() {
    BufferedReader cpuReader = null;
    BufferedReader pidReader = null;

    try {
    	// 1.读取 /proc/stat 和 /proc/" + mPid + "/stat 文件里的数据信息。
        cpuReader = new BufferedReader(new InputStreamReader(
                new FileInputStream("/proc/stat")), BUFFER_SIZE);
        String cpuRate = cpuReader.readLine();
        if (cpuRate == null) {
            cpuRate = "";
        }

        if (mPid == 0) {
            mPid = android.os.Process.myPid();
        }
        pidReader = new BufferedReader(new InputStreamReader(
                new FileInputStream("/proc/" + mPid + "/stat")), BUFFER_SIZE);
        String pidCpuRate = pidReader.readLine();
        if (pidCpuRate == null) {
            pidCpuRate = "";
        }
		// 2.对这两个文件的数据进行解析。
        parse(cpuRate, pidCpuRate);
    } catch (Throwable throwable) {
        Log.e(TAG, "doSample: ", throwable);
    } finally {
        try {
            if (cpuReader != null) {
                cpuReader.close();
            }
            if (pidReader != null) {
                pidReader.close();
            }
        } catch (IOException exception) {
            Log.e(TAG, "doSample: ", exception);
        }
    }
}

// 总共只缓存10条数据,所以就全部获取了,与堆栈信息根据时间区间来获取的方式不一样。
public String getCpuRateInfo() {
    StringBuilder sb = new StringBuilder();
    synchronized (mCpuInfoEntries) {
        for (Map.Entry<Long, String> entry : mCpuInfoEntries.entrySet()) {
            long time = entry.getKey();
            sb.append(BlockInfo.TIME_FORMATTER.format(time))
                    .append(' ')
                    .append(entry.getValue())
                    .append(BlockInfo.SEPARATOR);
        }
    }
    return sb.toString();
}


public boolean isCpuBusy(long start, long end) {
    if (end - start > mSampleInterval) {
        long s = start - mSampleInterval;
        long e = start + mSampleInterval;
        long last = 0;
        synchronized (mCpuInfoEntries) {
            for (Map.Entry<Long, String> entry : mCpuInfoEntries.entrySet()) {
                long time = entry.getKey();
                if (s < time && time < e) {
                    if (last != 0 && time - last > BUSY_TIME) {
                        return true;
                    }
                    last = time;
                }
            }
        }
    }
    return false;
}
小结:
CPU 信息的采集?
读取并解析
/proc/stat和/proc/ + mPid + /stat文件里的数据信息。
CPU 信息的获取?
CPU 信息默认只缓存10条,所以在获取的时候,不做时间区间的过滤。
如何判断给定时间间隔内 CPU 是否处于 Busy 状态?
在给定是时间区间内,前后各扩展一个 mSampleInterval 时间区间,判断这个时间区间内的 CPU 使用时间与最近一次使用时间的间隔是否大于 BUSY_TIME,如果大于 BUSY_TIME,说明 CPU 处于 Busy 状态。
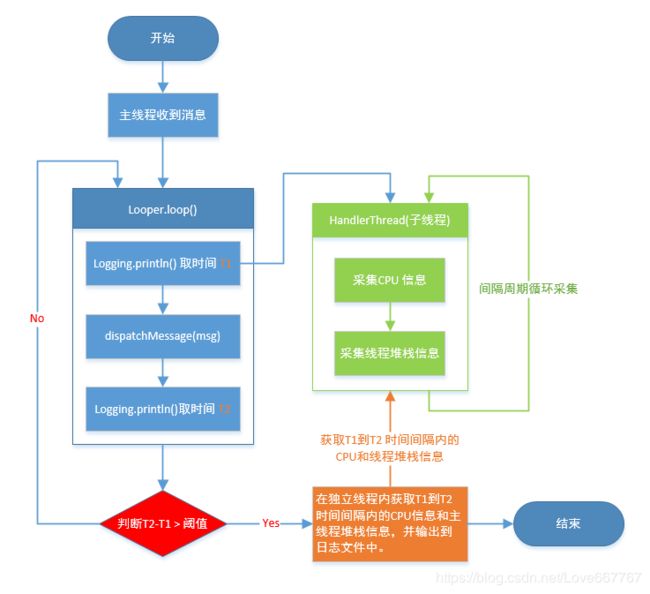
四、小结
流程图如下: