时间序列数据趋势分析 Cox-Stuart、Mann-Kendall、Dickey-Fuller
- 时序数据趋势检测
- 斜率法
- Cox-Stuart检验
- Mann-Kendall检验
- 稳定性检验
- 滚动统计
- Dickey-Fuller(迪基-福勒检验、单根检验)
时序数据趋势检测
斜率法
原理:
斜率法的原理就是使用最小二乘等方法对时序数据进行拟合,然后根据拟合成的直线的斜率k判断序列的数据走势,当k>0时,则代表趋势上升;当k<0时,则代表趋势下降。
优缺点:
优点是方法简单;缺点是要求趋势是线性的,当数去波动较大时无法准确拟合。
Cox-Stuart检验
原理
直接考虑数据的变化趋势,若数据有上升趋势,那么排在后面的数据的值要比排在前面的数据的值显著的大,反之,若数据有下降趋势,那么排在后面的数据的值要比排在前面的数据的值显著的小,利用前后两个时期不同数据的差值正负来判断数据总的变化趋势。
算法步骤
- 取xi和xi+c组成一对(xi,xi+c)。这里如果n为偶数,则c=n/2,如果n是奇数,则c=(n+1)/2。当n为偶数时,共有n’=c对,而n是奇数时,共有 n’=c-1对。
- 用每一对的两元素差Di=xi−xi+c的符号来衡量增减。令S+为正的Di的数目,S−为负的Di的数目。显然当正号太对时有下降趋势,反之有增长趋势。在没有趋势的零假设下他们因服从二项分布b(n’,0.5)。
- 用p(+)表示取到正数的概率,用p(-)表示取到负数的概率,这样就得到符号检验方法来检验序列是否存在趋势性。
优缺点:
优点是不依赖趋势结构,可以快速判断趋势是否存在;缺点是未考虑数据的时序性,仅从符号检验来判断。
代码
#!/usr/bin/env python
# -*- coding: utf-8 -*-
# @Author  : LaoChen

import numpy as np
import pandas as pd
import scipy.stats as stats
def cox_staut(list_c):
    lst=list_c.copy()
    n0=len(lst)
    if n0%2==1:
        del lst[int((n0-1)/2)]
    c=int(len(lst)/2)
    pos=neg=0
    for i in range(c):
        diff=lst[i+c]-lst[i]
        if diff>0:
            pos+=1
        elif diff<0:
            neg+=1
        else:
            continue
    n1=pos+neg
    k=min(pos,neg)
    p=2*stats.binom.cdf(k,n1,0.5)
    print('fall:%i  rise:%i  p-value:%f'%(neg,pos,p))
cox_staut([206,223,235,264,229,217,188,204,182,230,223,227,242,238,207,208,
           216,233,233,274,234,227,221,214,226,228,235,237,243,240,231,210])
Mann-Kendall检验
原理
Mann-Kendall检验不需要样本遵循一定的分布,也不受少数异常值的干扰。在Mann-Kendall检验中,原假设H0为时间序列数据(X1,…,Xn),是n个独立的、随机变量同分布的样本;备择假设H1 是双边检验,对于所有的k,j≤n,且k≠j,Xk和Xj的分布是不相同的。若原假设是不可接受的,即在α置信水平上,时间序列数据存在明显的上升或下降趋势。对于统计量Z,大于0时是上升趋势;小于0时是下降趋势。
算法步骤
- 将数据按采集时间列出:x1,x2,…,xn,即分别在时间1,2,…,n得到的数据。
- 确定所有n(n-1)/2个xj−xk差值的符号,其中j > k
- 令sgn(xj−xk)作为指示函数,依据xj−xk的正负号取值为1,0或-1
- 计算S=∑n−1k−1∑nj−k+1sgn(xj−xk)。即差值为正的数量减去差值为负的数量。如果S是一个正数,那么后一部分的观测值相比之前的观测值会趋向于变大;如果S是一个负数,那么后一部分的观测值相比之前的观测值会趋向于变小。
- 如果n≤10,依据Gilbert (1987, page 209, Section 16.4.1)中所描述,要在概率表 (Gilbert 1987, Table A18, page 272) 中查找S。如果此概率小于α(认为没有趋势时的截止概率),那就拒绝零假设,认为趋势存在。如果在概率表中找不到n(存在结数据——tied data values——会发生此情况),就用表中远离0的下一个值。比如S=12,如果概率表中没有S=12,那么就用S=13来处理也是一样的。如果n > 10,则依以下步骤来判断有无趋势。这里遵循的是Gilbert (1987, page 211, Section 16.4.2)中的程序。
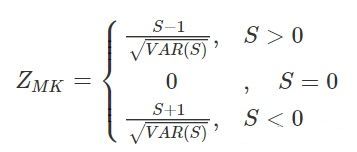
- 计算S的方差如下:VAR(S)=118[n(n−1)(2n+5)−∑gp−1tp(tp−1)(2tp+5)]。其中g是结组(tied groups)的数量,tp是第p组的观测值的数量。例如:在观测值的时间序列{23, 24, 29, 6, 29, 24, 24, 29, 23}中有g = 3个结组,相应地,对于结值(tiied value)23有t1=2、结值24有t2=3、结值29有t3=S3。当因为有相等值或未检测到而出现结时,VAR(S)可以通过Helsel (2005, p. 191)中的结修正方法来调整。
- 计算MK检验统计量Z_{MK}:

- 设想要测试零假设。H0(没有单调趋势)对比替代假设Ha(有单调增趋势),其1型错误率为α,0<α<0.50(注意α是MK检验错误地拒绝了零假设时可容忍的概率——即MK检验拒绝了零假设是错误地,但这个事情发生概率是α,我们可以容忍这个错误)。如果ZMK≥Z1−α,就拒绝零假设H0,接受替代假设Ha,其中Z1−α是标准正态分布的100(1−α)th百分位。
- 测试上面的H0与Ha(有单调递减趋势),其1型错误率为alpha,0<α<0.5,如果ZZMK≤–Z1−α,就拒绝零假设H0,接受替代假设Ha
- 测试上面的H0与Ha(有单调递增或递减趋势),其1型错误率为alpha,0<α<0.5,如果|ZMK|≥Z1−α2,就拒绝零假设H0,接受替代假设Ha,其中竖线代表绝对值。
import math
from scipy.stats import norm, mstats
def mk_test(x, alpha=0.05):
    n = len(x)

    # calculate S
    s = 0
    for k in range(n-1):
        for j in range(k+1, n):
            s += np.sign(x[j] - x[k])

    # calculate the unique data
    unique_x, tp = np.unique(x, return_counts=True)
    g = len(unique_x)

    # calculate the var(s)
    if n == g:  # there is no tie
        var_s = (n*(n-1)*(2*n+5))/18
    else:  # there are some ties in data
        var_s = (n*(n-1)*(2*n+5) - np.sum(tp*(tp-1)*(2*tp+5)))/18

    if s > 0:
        z = (s - 1)/np.sqrt(var_s)
    elif s < 0:
        z = (s + 1)/np.sqrt(var_s)
    else: # s == 0:
        z = 0

    # calculate the p_value
    p = 2*(1-norm.cdf(abs(z)))  # two tail test
    h = abs(z) > norm.ppf(1-alpha/2)

    if (z < 0) and h:
        trend = 'decreasing'
    elif (z > 0) and h:
        trend = 'increasing'
    else:
        trend = 'no trend'

    return trend
在python中使用mann-Kendall,可以用scipy.stats.kendalltau,该函数返回两个值:tau-反映两个序列的相关性,接近1的值表示强烈的正相关,接近-1的值表示强烈的负相关;p_value:p值反映的是假设检验的双边p值,其零假设为无关联——即通常所谓的显著性水平,一般取p<0.05为显著。
稳定性检验
滚动统计
平稳时间序列有两种定义:严平稳和宽平稳
严平稳顾名思义,是一种条件非常苛刻的平稳性,它要求序列随着时间的推移,其统计性质保持不变。对于任意的τ,其联合概率密度函数满足:
![]()
严平稳的条件只是理论上的存在,现实中用得比较多的是宽平稳的条件。
宽平稳也叫弱平稳或者二阶平稳(均值和方差平稳),满足:
常数均值
常数方差
常数自协方差
from statsmodels.tsa.stattools import adfuller
import pandas as pd
import matplotlib.pyplot as plt
import numpy as np
from statsmodels.graphics.tsaplots import plot_acf, plot_pacf

# 移动平均图
def draw_trend(timeSeries, size):
    f = plt.figure(facecolor='white')
    # 对size个数据进行移动平均
    rol_mean = timeSeries.rolling(window=size).mean()
    # 对size个数据进行加权移动平均
    rol_weighted_mean = pd.ewma(timeSeries, span=size)

    timeSeries.plot(color='blue', label='Original')
    rolmean.plot(color='red', label='Rolling Mean')
    rol_weighted_mean.plot(color='black', label='Weighted Rolling Mean')
    plt.legend(loc='best')
    plt.title('Rolling Mean')
    plt.show()

def draw_ts(timeSeries):
    f = plt.figure(facecolor='white')
    timeSeries.plot(color='blue')
    plt.show()
Dickey-Fuller(迪基-福勒检验、单根检验)
单位根检验是指检验序列中是否存在单位根,因为存在单位根就是非平稳时间序列了。单位根就是指单位根过程,可以证明,序列中存在单位根过程就不平稳,会使回归分析中存在伪回归。
而迪基-福勒检验(Dickey-Fuller test)和扩展迪基-福勒检验(Augmented Dickey-Fuller test可以测试一个自回归模型是否存在单位根(unit root)。迪基-福勒检验模式是D. A迪基和W. A福勒建立的。
在python中对时间序列有statsmodel库,在statsmodels.tsa.stattools.adfuller中可进行adf校验
'''
  Unit Root Test
   The null hypothesis of the Augmented Dickey-Fuller is that there is a unit
   root, with the alternative that there is no unit root. That is to say the
   bigger the p-value the more reason we assert that there is a unit root
'''
def testStationarity(ts):
    dftest = adfuller(ts)
    # 对上述函数求得的值进行语义描述
    dfoutput = pd.Series(dftest[0:4], index=['Test Statistic','p-value','#Lags Used','Number of Observations Used'])
    for key,value in dftest[4].items():
        dfoutput['Critical Value (%s)'%key] = value
    return dfoutput