Python三次样条插值
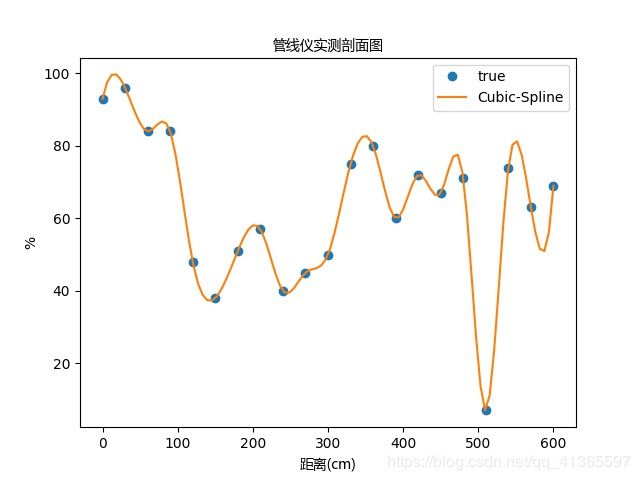
本程序实现从txt文件中读取两列数据,然后进行三次样条插值,绘制出一条平滑的曲线。
需要解决的一些问题:
-
中文字体显示异常,解决方法:https://blog.csdn.net/weixin_34233856/article/details/86839152
-
切片方法:
x = a[:,0] # 取第一列数据
y = a[:,1] # 取第二列数据 -
插值方法介绍:
https://docs.scipy.org/doc/scipy/reference/tutorial/interpolate.html#spline-interpolation-in-1-d-procedural-interpolate-splxxx -
关于 Pandas 的使用,参看另一篇博客:
方法一:使用 np.loadtxt( ) 方法读取数据
# code:utf-8  	Ubuntu
import matplotlib.pyplot as plt
from scipy import interpolate
import numpy as np

import matplotlib.font_manager as mpt
zhfont=mpt.FontProperties(fname='/usr/share/fonts/custom/msyh.ttf') #显示中文字体
#导入数据
file = 'data.txt'
a = np.loadtxt(file)
# 数组切片
x = a[:,0]  # 取第一列数据
y = a[:,1]  # 取第二列数据
# 进行样条插值
tck = interpolate.splrep(x,y)
xx = np.linspace(min(x),max(x),100)
yy = interpolate.splev(xx,tck,der=0)
print(xx)
# 画图
plt.plot(x,y,'o',xx,yy)
plt.legend(['true','Cubic-Spline'])
plt.xlabel('距离(cm)', fontproperties=zhfont) #注意后面的字体属性
plt.ylabel('%')
plt.title('管线仪实测剖面图', fontproperties=zhfont)
# 保存图片
plt.savefig('out.jpg')
plt.show()
# code:utf-8  	Windows 7 Utilmate
import matplotlib.pyplot as plt
import pandas as pd
import numpy as np
from scipy import interpolate

# 解决中文显示问题
import matplotlib as mpl
mpl.rcParams["font.sans-serif"] = ["SimHei"]
mpl.rcParams["axes.unicode_minus"] = False

# 导入数据
file = pd.read_csv('data.txt',sep='\s+',
                header = None, skiprows=[17],
                # skiprows 跳过第18行
                names = ['x', 'value'])

data = pd.DataFrame(file)
# 数组切片
x = data['x']  # 取第一列数据
y = data['value']  # 取第二列数据
# 进行样条插值
tck = interpolate.splrep(x,y)
xx = np.linspace(min(x),max(x),100)
yy = interpolate.splev(xx,tck,der=0)
print(yy)
# 画图
plt.plot(x,y,'o',xx,yy)
plt.legend(['true','Cubic-Spline'])
plt.xlabel('距离(cm)')
plt.ylabel('%')
plt.title('管线仪实测剖面图')
# 保存图片
plt.savefig('out2.png',dpi=600 )
# 设置需要保存图片的分辨率
plt.show()
0	93
30	96
60	84
90	84
120	48
150	38
180	51
210	57
240	40
270	45
300	50
330	75
360	80
390	60
420	72
450	67
480	71
510	7
540	74
570	63
600	69

