2020美赛数学建模 校级培训——Week_3
引言:
博主在今年寒假参加了学校组织的美国大学生数学建模竞赛培训, 在此,用博客来记录这段培训时光。
Day 11: 2020.1.14
第三轮模拟题:2017MCM_C
1. Problem
Problem C: “Cooperate and navigate” Traffic capacity is limited in
many regions of the United States due to the number of lanes of roads.
For example, in the Greater Seattle area drivers experience long
delays during peak traffic hours because the volume of traffic exceeds
the designed capacity of the road networks. This is particularly
pronounced on Interstates 5, 90, and 405, as well as State Route 520,
the roads of particular interest for this problem.Self-driving, cooperating cars have been proposed as a solution to
increase capacity of highways without increasing number of lanes or
roads. The behavior of these cars interacting with the existing
traffic flow and each other is not well understood at this point.The Governor of the state of Washington has asked for analysis of the
effects of allowing self-driving, cooperating cars on the roads listed
above in Thurston, Pierce, King, and Snohomish counties. (See the
provided map and Excel spreadsheet). In particular, how do the effects
change as the percentage of self-driving cars increases from 10% to
50% to 90%? Do equilibria exist? Is there a tipping point where
performance changes markedly? Under what conditions, if any, should
lanes be dedicated to these cars? Does your analysis of your model
suggest any other policy changes?Your answer should include a model of the effects on traffic flow of
the number of lanes, peak and/or average traffic volume, and
percentage of vehicles using self-driving, cooperating systems. Your
model should address cooperation between self-driving cars as well as
the interaction between self- driving and non-self-driving vehicles.
Your model should then be applied to the data for the roads of
interest, provided in the attached Excel spreadsheet.Some useful background information:
- On average, 8% of the daily traffic volume occurs during peak travel hours.
- The nominal speed limit for all these roads is 60 miles per hour.
- Mileposts are numbered from south to north, and west to east.
- Lane widths are the standard 12 feet.
- Highway 90 is classified as a state route until it intersects Interstate 5.
- In case of any conflict between the data provided in this problem and any other source, use the data provided in this problem.
Definitions: milepost: A marker on the road that measures distance in
miles from either the start of the route or a state boundary. average
daily traffic: The average number of cars per day driving on the road.
interstate: A limited access highway, part of a national system.
state route: A state highway that may or may not be limited access.
route ID: The number of the highway. increasing direction: Northbound
for N-S roads, Eastbound for E-W roads. decreasing direction:
Southbound for N-S roads, Westbound for E-W roads.
2.Translation
问题C:“合作和导航”
由于道路的数量,美国许多地区的交通容量有限。
例如,在大西雅图地区,司机在交通高峰时段遇到长时间的延误
因为交通量超过了道路网络的设计容量。这是特别
在州际公路5号,90号和405号以及州道路520号,特别感兴趣的道路上发布
对于这个问题。
自动驾驶,合作车已被提出作为增加公路容量的解决方案
而不增加车道或道路的数量。这些汽车的行为与现有的交互
交通流和对方在这一点上还不太了解。
华盛顿州州长要求分析允许自驾的影响,
在Thurston,Pierce,King和Snohomish县上列的道路上合作汽车。 (看到
提供的地图和Excel电子表格)。特别是,效果如何改变
自驾车的百分比从10%增加到50%到90%?是否存在平衡?有没有
性能变化明显的倾翻点?在什么条件下,如果有的话,应该有车道
专用于这些车?您对模型的分析是否表明有任何其他政策变化?
您的答案应包括对车道数量,峰值和/或车道数量的影响的模型
平均交通量,以及使用自动驾驶,合作系统的车辆的百分比。你的
模型应该解决自驾车之间的合作以及自驱动车之间的相互作用
和非自驾车辆。您的模型应该应用于的道路的数据
利息,在附加的Excel电子表格中提供。
您的MCM提交应包含1页的摘要表,1 - 2页的信
总督办公室和您的解决方案(不超过20页),最多23页。注意:
附录和参考文献不计入23页的限制。
一些有用的背景信息:
•平均而言,每日交通量的8%发生在高峰旅行时间。
•所有这些道路的名义速度限制为每小时60英里。
•里程数从南到北,从西到东。
•车道宽度是标准的12英尺。
•高速公路90被分类为状态路线,直到它与州际5相交。
•如果此问题中提供的数据与任何其他来源之间存在冲突,请使用
这个问题提供的数据。
定义:
milepost:在路上测量距离,从路线的起点或a
状态边界。
平均每日交通量:在道路上行驶的平均每天的汽车数量。
州际公路:作为国家系统的一部分的有限进出高速公路。
国家路线:可能受限或不受限制的国家公路。
路由ID:高速公路的编号。
增加方向:N-S道北行,E-W道东行。
下降方向:N-S道南行,E-W道西行。 附件 2017_MCM_Problem_C_Data.xlsx
2017_MCM_Problem_C_Map.pdf
3. Problem-solving ideas
解决方案由三个主要部分组成:
首先,他们提出了交通流、密度和平均速度之间关系的宏观(连续)模型。除了改进传统经验模型的合理性外,他们还允许进行直接调整,以反映自动驾驶/合作车辆的比例。
其次,建立了一个离散模型来描述不同交通水平下的车道变化动力学,以及传统的自动驾驶/非相互作用和自动驾驶的性能。
最后,他们对问题中提供的真实世界数据进行了流密度-平均速度关系模型的检验。
Day 12: 2020.1.15
第三轮模拟题:2017MCM_C
1. Problem Analysis
- 思路:
首先,交通流、密度和平均速度之间关系的宏观(连续)模型。改进传统经验模型,检验合理性,允许进行直接调整,以反映自动驾驶/合作车辆的比例。
其次,建立了一个离散模型来描述不同交通水平下的车道变化动力学,以及传统的自动驾驶/非相互作用和自动驾驶的性能。
最后,对问题中提供的真实世界数据进行了流密度-平均速度关系模型的检验。
- 一、一些关键假设:
- 自动驾驶车和合作车不需要安全间隔(即他们的安全间隔为0)
- 所有驾驶的车辆在行驶过程中都不允许变道
- 在考虑自动驾驶车专用车道时,假设自动驾驶车和合作车不能在非专用车道上行驶,其他车也不能在专用车道上行驶
- 二、一些定义和概念
安全间隔
1)单元长度
2)车道数:将两个方向的车道视为一样,所以车道数为两个方向的车道数之和
3)相邻车的距离:用单元数衡量,计算方式为前车位置减去后车位置再减1
4)道路区块长度:用单元数衡量,计算方式为道路实际长度除以单元长度
5)最大速度:通过计算转换为每秒通过的单元格数
6)人类反应时间:定位1秒
7)瞬时速度:每秒通过的单元格数
8)交通量:一段时间内通过道路区块终端的车数平均速度:首先计算道路上车的数目总数,然后除以平均通过时间,再用道路实际长度除以平均通过时间
衡量交通平衡点的两个量
- 三、研究的问题
不考虑高峰期,研究自动驾驶车比例对车速和时空平衡点(拥堵)的两个量的影响
方法1:先计算每条车道出现自动驾驶车和非自动驾驶车的概率(用到了数据里的每日交通量,并假设),然后对模型里下一时刻车速做处理,根据不同情况(前车车速,安全间隔,是否是自动驾驶车)下一时刻车速也不同,以此进行模拟,最后进行敏感性分析(自动驾驶车比例的增加效果是否显著)
方法2;在元胞自动机的基础上,构建了一个混合协作模型,独立地模拟了交通网络的各个部分。首先,在我们的基本模型中,我们假定交通量在一天内满足均匀分布。在知道交通网络每一段的交通量和行车线后,他们就可以在一段时间内得到每个路段的交通密度,并继续使用不同的自动驾驶比率。减少交通流量平常/高峰时刻自动驾驶车比例对交通(车速,时空平衡点)的影响
方法1:考虑时间模型,假设交通密度函数随时间的变化与一天内的双高斯分布相同,即存在两个交通高峰周期
方法2:利用对偶高斯函数得到不同时刻的车密度,对所有道路块的所有时刻进行元胞自动机模拟,并聚焦于17:00时的道路状况,画出交通图,最后进行敏感性分析
方法3:利用泊松分布对汽车的生成过程进行了建模。该模型在公路路段上生成指定的车辆体积。并区分了高峰时间和非高峰时段的交通量。在此基础上,对车辆跟随和换车道行为进行了建模。最后,提出了一个分析高速公路交通流行为的概率模型。通过各种仿真,验证了模型的可行性。然后,他们将大西雅图地区四条高速公路的数据应用于模型。结果表明,随着自动驾驶合作车辆比例的增加,车辆的通行能力也随之增加.将自动驾驶车专用车道纳入考虑,
方法:在基于时间的模型基础上,构造一个专用车道模型,考虑了自动驾驶车辆的专用车道,并继续与基于时间的模型进行类似的模拟。最后,利用每段路段车辆的平均速度来评价车辆的性能和通行能力。他们的模型给出了自动驾驶对交通运输影响的结果
2. Paper Template
Day 13: 2020.1.16
第三轮模拟题:2017MCM_C
1. Paper first draft
Part 1
Part 2
Part 3
2. Paper extension
Part 4
Part 5
Day 14: 2020.1.17
第三轮模拟题:2017MCM_C
1. Revised draft
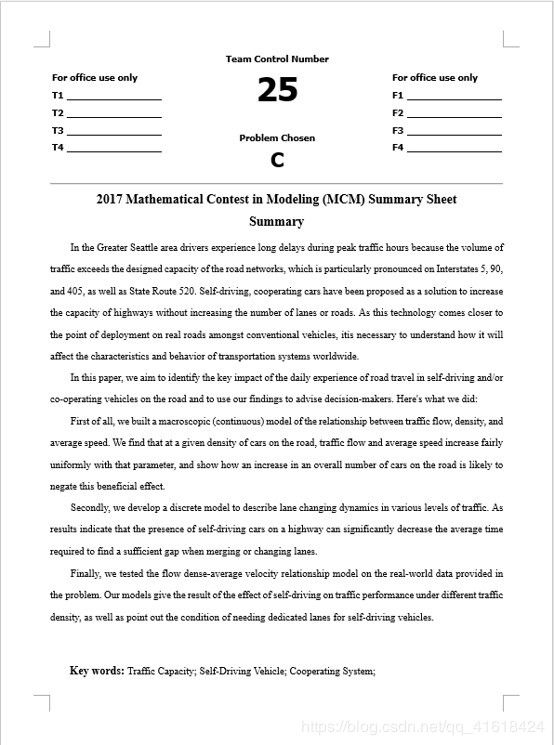
2017 Mathematical Contest in Modeling (MCM) Summary Sheet
In the Greater Seattle area drivers experience long delays during peak
traffic hours because the volume of traffic exceeds the
designed capacity of the road networks, which is particularly
pronounced on Interstates 5, 90, and 405, as well as State Route 520.
Self-driving, cooperating cars have been proposed as a solution to
increase the capacity of highways without increasing the number of
lanes or roads. As this technology comes closer to the point of
deployment on real roads amongst conventional vehicles, itis necessary
to understand how it will affect the characteristics and behavior of
transportation systems worldwide. In this paper, we aim to identify
the key impact of the daily experience of road travel in self-driving
and/or co-operating vehicles on the road and to use our findings to
advise decision-makers. Here’s what we did: First of all, we built a
macroscopic (continuous) model of the relationship between traffic
flow, density, and average speed. We find that at a given density of
cars on the road, traffic flow and average speed increase fairly
uniformly with that parameter, and show how an increase in an overall
number of cars on the road is likely to negate this beneficial effect.
Secondly, we develop a discrete model to describe lane changing
dynamics in various levels of traffic. As results indicate that the
presence of self-driving cars on a highway can significantly decrease
the average time required to find a sufficient gap when merging or
changing lanes. Finally, we tested the flow dense-average velocity
relationship model on the real-world data provided in the problem. Our
models give the result of the effect of self-driving on traffic
performance under different traffic density, as well as point out the
condition of needing dedicated lanes for self-driving vehicles. Key
words: Traffic Capacity; Self-Driving Vehicle; Cooperating System;
Day 15: 2020.1.18
第三轮模拟题:2017MCM_C
1、Revised draft Again
revision 1
revision 2
revision 3
2. Final Version
Summary
Contents
Day 16: 2020.1.19
提前完成论文,休息~
结语
至此,第三周培训结束,我们也顺利完成了最后一篇论文!
美赛培训结束感悟
历时16天的美赛培训终于结束了!
虽然过程很艰难,但最后终于还是挺过来!
无论结果如何,都为自己点个赞,
祝贺自己成功完成了这一次的美赛培训!
最后,就是期待最终的选拔结果啦,
无论选拔通过与否,都要以积极的态度面对,
加油,奥利给!
注:第三轮模拟题的论文会放在附件里,有需要的小伙伴可以下载~
链接:第三轮:2017MCM_C.pdf


