ROS总结——ROS话题
理解ROS话题
本博客是对http://wiki.ros.org/上ROS教程的学习总结,欢迎大家交流学习。本节介绍ROS话题(topics)以及如何使用rostopic 和 rxplot 命令行工具。
1.运行turtlesim
首先确保roscore已经运行, 打开一个新的终端:
$ roscore在一个新的终端中运行:
$ rosrun turtlesim turtlesim_node需要通过键盘来控制turtle的运动,在一个新的终端中运行:
$  rosrun turtlesim turtle_teleop_key
Reading from keyboard
---------------------------
Use arrow keys to move the turtle.
现在可以使用键盘上的方向键来控制turtle运动了。如果不能控制,请选中turtle_teleop_key所在的终端窗口以确保你的按键输入能够被捕获。

现在可以控制turtle运动了,下面来说说控制turtle运动的原理。
2.ROS Topics
turtlesim_node节点和turtle_teleop_key节点之间是通过一个ROS话题来互相通信的。turtle_teleop_key在一个话题上发布按键输入消息,而turtlesim则订阅该话题以接收该消息。下面让我们使用rqt_graph来显示当前运行的节点和话题。
2.1. 使用 rqt_graph
rqt_graph能够创建一个显示当前系统运行情况的动态图形。rqt_graph是rqt程序包中的一部分。如果你没有安装,请通过以下命令来安装:
$  sudo apt-get install ros-indigo-rqt
$  sudo apt-get install ros-indigo-rqt-common-plugins
qw 在一个新终端中运行:
$ rosrun rqt_graph rqt_graph
如果将鼠标放在/turtle1/command_velocity上方,相应的ROS节点(蓝色和绿色)和话题(红色)就会高亮显示。正如你所看到的,turtlesim_node和turtle_teleop_key节点正通过一个名为 /turtle1/command_velocity的话题来互相通信。

2.2. rostopic介绍
rostopic命令工具能让你获取有关ROS话题的信息,可以使用帮助选项查看rostopic的子命令:
$  rostopic -h
rostopic is a command-line tool for printing information about ROS Topics.

Commands:
    rostopic bw display bandwidth used by topic
    rostopic delay  display delay of topic from timestamp in header
    rostopic echo   print messages to screen
    rostopic find   find topics by type
    rostopic hz display publishing rate of topic
    rostopic info   print information about active topic
    rostopic list   list active topics
    rostopic pub    publish data to topic
    rostopic type   print topic type

Type rostopic <command> -h for more detailed usage, e.g. 'rostopic echo -h'
接下来将使用其中的一些子命令来查看turtlesim的原理。
2.3. 使用 rostopic echo**
rostopic echo可以显示在某个话题上发布的数据,基本用法:
rostopic echo [topic]在一个新终端中看一下turtle_teleop_key节点在/turtle1/cmd_vel话题上发布的数据。
$ rostopic echo /turtle1/cmd_vel可能看不到任何东西因为现在还没有数据发布到该话题上。接下来通过按下方向键使turtle_teleop_key节点发布数据。记住如果turtle没有动起来的话就需要重新选中turtle_teleop_key节点运行时所在的终端窗口。现在当按下向上方向键时应该会看到下面的信息:
linear:
x: 2.0
y: 0.0
z: 0.0
angular:
x: 0.0
y: 0.0
z: 0.0
---
linear:
x: 0.0
y: 0.0
z: 0.0
angular:
x: 0.0
y: 0.0
z: -2.0
---
linear:
x: 0.0
y: 0.0
z: 0.0
angular:
x: 0.0
y: 0.0
z: -2.0
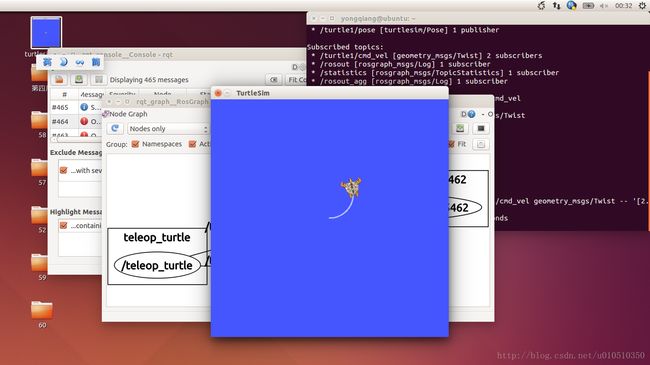
---现在再看一下rqt_graph(可能需要刷新一下ROS graph)。正如所看到的,rostopic echo(红色显示部分)现在也订阅了/turtle1/cmd_vel话题。

2.4. 使用 rostopic list
rostopic list能够列出所有当前订阅和发布的话题。查看一下list子命令需要的参数,在一个新终端中运行:
$  rostopic list -h
rostopic is a command-line tool for printing information about ROS Topics.

Commands:
    rostopic bw display bandwidth used by topic
    rostopic delay  display delay of topic from timestamp in header
    rostopic echo   print messages to screen
    rostopic find   find topics by type
    rostopic hz display publishing rate of topic
    rostopic info   print information about active topic
    rostopic list   list active topics
    rostopic pub    publish data to topic
    rostopic type   print topic type

Type rostopic <command> -h for more detailed usage, e.g. 'rostopic echo -h'
在rostopic list中使用verbose选项,会显示出有关所发布和订阅的话题及其类型的详细信息:
$  rostopic list -v
Published topics:
 * /turtle1/color_sensor [turtlesim/Color] 1 publisher
 * /turtle1/cmd_vel [geometry_msgs/Twist] 1 publisher
 * /rosout [rosgraph_msgs/Log] 6 publishers
 * /rosout_agg [rosgraph_msgs/Log] 1 publisher
 * /turtle1/pose [turtlesim/Pose] 1 publisher

Subscribed topics:
 * /turtle1/cmd_vel [geometry_msgs/Twist] 2 subscribers
 * /rosout [rosgraph_msgs/Log] 1 subscriber
 * /statistics [rosgraph_msgs/TopicStatistics] 1 subscriber
 * /rosout_agg [rosgraph_msgs/Log] 1 subscriber
3. ROS Messages
话题之间的通信是通过在节点之间发送ROS消息实现的。对于发布器(turtle_teleop_key)和订阅器(turtulesim_node)之间的通信,发布器和订阅器之间必须发送和接收相同类型的消息。这意味着话题的类型是由发布在它上面的消息类型决定的。使用rostopic type命令可以查看发布在某个话题上的消息类型。
3.1. 使用 rostopic type
rostopic type 命令用来查看所发布话题的消息类型,基本用法:
rostopic type [topic]运行:
$  rostopic type /turtle1/cmd_vel
geometry_msgs/Twist
可以使用rosmsg命令来查看消息的详细情况:
$  rosmsg show geometry_msgs/Twist
geometry_msgs/Vector3 linear
  float64 x
  float64 y
  float64 z
geometry_msgs/Vector3 angular
  float64 x
  float64 y
  float64 z
现在已经知道了turtlesim节点所期望的消息类型,接下来就可以给turtle发布命令了。
3.2. 使用 rostopic pub
rostopic pub可以把数据发布到当前某个正在广播的话题上,基本用法:
rostopic pub [topic] [msg_type] [args]例如:
$ rostopic pub -1 /turtle1/cmd_vel geometry_msgs/Twist -- '[2.0, 0.0, 0.0]' '[0.0, 0.0, 1.8]'以上命令会发送一条消息给turtlesim,告诉它以2.0大小的线速度和1.8大小的角速度开始移动。
详细分析一下其中的每一个参数:
rostopic pub:这条命令将会发布消息到某个给定的话题。
-1:(单个破折号)这个参数选项使rostopic发布一条消息后马上退出。
/turtle1/cmd_vel:这是消息所发布到的话题名称。
geometry_msgs/Twist:这是所发布消息的类型。
–:(双破折号)这会告诉命令选项解析器接下来的参数部分都不是命令选项。这在参数里面包含有破折号-(比如负号)时是必须要添加的。
2.0 1.8 :正如之前提到的,在一个turtlesim/Velocity消息里面包含有两个浮点型元素:linear和angular。在本例中,2.0是linear的值,1.8是angular的值。这些参数其实是按照YAML语法格式编写的,这在YAML文档中有更多的描述。
可能已经注意到turtle已经停止移动了。这是因为turtle需要一个稳定的频率为1Hz的命令流来保持移动状态。可以使用rostopic pub -r命令来发布一个稳定的命令流:
$ rostopic pub /turtle1/cmd_vel geometry_msgs/Twist -r 1 -- '[2.0, 0.0, 0.0]' '[0.0, 0.0, 1.8]'这条命令以1Hz的频率发布速度命令到速度话题上。
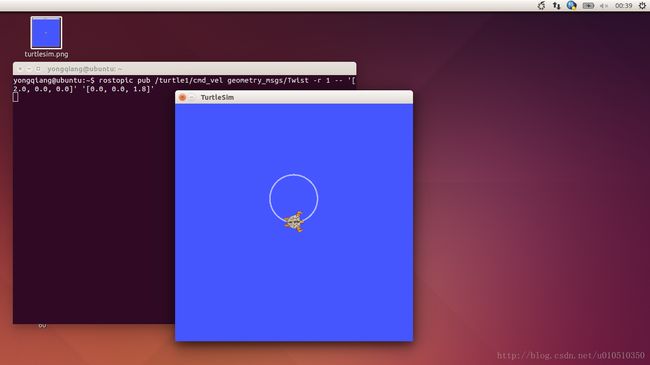
也可以看一下rqt_graph中的情形,可以看到rostopic发布器节点(红色)正在与rostopic echo节点(绿色)进行通信:

正如所看到的,turtle正沿着一个圆形轨迹连续运动。可以在一个新终端中通过rostopic echo命令来查看turtlesim所发布的数据。
3.3. 使用 rostopic hz
rostopic hz命令可以用来查看数据发布的频率,基本用法:
rostopic hz [topic]看一下turtlesim_node发布/turtle/pose时有多快:
$  rostopic hz /turtle1/pose
subscribed to [/turtle1/pose]
average rate: 62.489
    min: 0.016s max: 0.016s std dev: 0.00009s window: 60
average rate: 62.495
    min: 0.016s max: 0.016s std dev: 0.00008s window: 122
average rate: 62.503
    min: 0.016s max: 0.016s std dev: 0.00009s window: 185
average rate: 62.500
    min: 0.016s max: 0.016s std dev: 0.00008s window: 248
average rate: 62.501
    min: 0.011s max: 0.022s std dev: 0.00045s window: 309
average rate: 61.484
    min: 0.011s max: 0.113s std dev: 0.00508s window: 367
average rate: 61.628
    min: 0.011s max: 0.113s std dev: 0.00470s window: 429
average rate: 61.740
    min: 0.011s max: 0.113s std dev: 0.00439s window: 492
average rate: 61.824
    min: 0.011s max: 0.113s std dev: 0.00413s window: 554
average rate: 61.892
    min: 0.011s max: 0.113s std dev: 0.00392s window: 617
average rate: 61.948
    min: 0.011s max: 0.113s std dev: 0.00373s window: 680
现在可以知道了turtlesim正以大约60Hz的频率发布数据给turtle,也可以结合rostopic type和rosmsg show命令来获取关于某个话题的更深层次的信息:
$  rostopic type /turtle1/cmd_vel | rosmsg show
geometry_msgs/Vector3 linear
  float64 x
  float64 y
  float64 z
geometry_msgs/Vector3 angular
  float64 x
  float64 y
  float64 z
到此已经完成了通过rostopic来查看话题相关情况的过程,接下来将使用另一个工具来查看turtlesim发布的数据。
4. 使用 rqt_plot
rqt_plot命令可以实时显示一个发布到某个话题上的数据变化图形。这里我们将使用rqt_plot命令来绘制正在发布到/turtle1/pose话题上的数据变化图形。首先,在一个新终端中运行rqt_plot命令:
$ rosrun rqt_plot rqt_plot这会弹出一个新窗口,在窗口左上角的一个文本框里面可以添加需要绘制的话题。在里面输入/turtle1/pose/x后之前处于禁用状态的加号按钮将会被使能变亮。按一下该按钮,并对/turtle1/pose/y重复相同的过程。现在可以在图形中看到turtle的x-y位置坐标图。
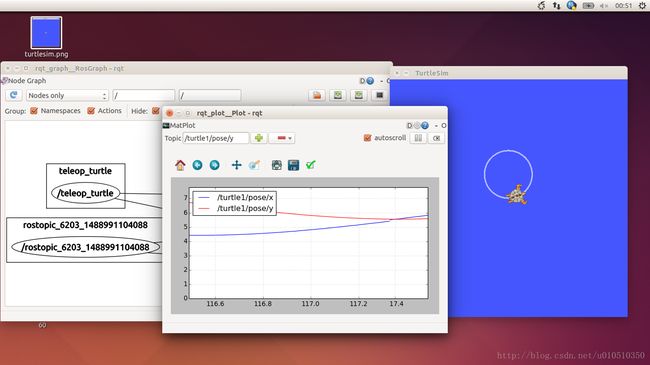
按下减号按钮会显示一组菜单隐藏图形中指定的话题。现在隐藏掉刚才添加的话题并添加/turtle1/pose/theta,会看到如下图所示的图形:

到此我们已经理解了ROS话题是如何工作的,下一节开开始讲解ROS服务和参数。