matlab绘制世界地图代码
matlab绘制世界地图
自我认为matlab画世界地图不好看,还是pyhon画的好看
这里是引用
%%
clear;clc;close all
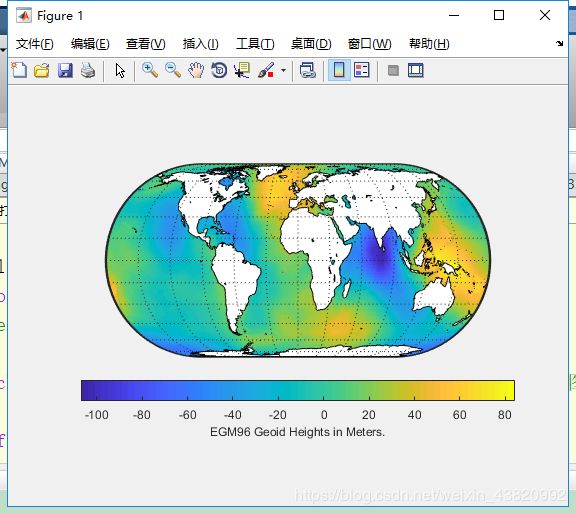
load geoid
% Create a figure with an Eckert projection.
figure
axesm eckert4; %注意axesm后面的m了吗?,可以使用maps命令查看所有的地图投影的方式,然后选一个
framem; gridm;%显示框架和网格线,注意后面都多了个m,表示map
axis off %关闭外部坐标轴,外部坐标轴不同于map axes

% Display the geoid as a texture map.
geoshow(geoid, geoidrefvec, 'DisplayType', 'texturemap');

% Create a colorbar and title.
hcb = colorbar('southoutside');
set(get(hcb,'Xlabel'),'String','EGM96 Geoid Heights in Meters.')

% Mask out all the land.
geoshow('landareas.shp', 'FaceColor', 'white');
load korea
figure;
worldmap(map, refvec)

% Display the Korean data grid as a texture map.
geoshow(gca,map,refvec,'DisplayType','texturemap');
demcmap(map)

% Display the land area boundary as black lines.
S = shaperead('landareas','UseGeoCoords',true);
geoshow([S.Lat], [S.Lon],'Color','black');
%%
clear;clc;close all
maps %查看当前可用的地图投影方式

%%  导入数据,全球海岸线
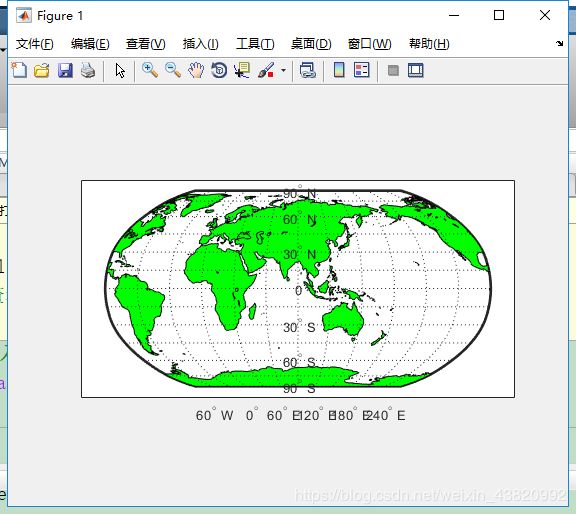
load coast

%% 绘图
axesm robinson
patchm(lat,long,'g');
 %% 设置属性
setm(gca);%查看当前可以设置的所有图形坐标轴(map axes)的属性
setm(gca,'Frame','on');%使框架可见
getm(gca,'Frame');%使用getm可以获取指定的图形坐标轴的属性
setm(gca,'Grid','on');%打开网格
setm(gca,'MLabelLocation',60);%标上经度刻度标签,每隔60度
setm(gca,'MeridianLabel','on');%设置经度刻度标签可见
setm(gca,'PLabelLocation',[-90:30:90])%标上经度刻度标签,[-90:30:90]
setm(gca,'ParallelLabel','on');%设置经度刻度标签可见
setm(gca,'MLabelParallel','south');%将经度刻度标签放在南方,即下部
setm(gca,'Origin',[0,90,0]);%设置地图的中心位置和绕中心点和地心点的轴旋转角度[latitude longitude orientation]
setm(gca,'PLabelMeridian',90);%将纬度标签放置在经度为90度的地方
% Worldmap with land areas, major lakes and rivers, and cities and
    % populated places
    ax = worldmap('World');
    setm(ax, 'Origin', [0 180 0])
    land = shaperead('landareas', 'UseGeoCoords', true);
    geoshow(ax, land, 'FaceColor', [0.5 0.7 0.5])
    lakes = shaperead('worldlakes', 'UseGeoCoords', true);
    geoshow(lakes, 'FaceColor', 'blue')
    rivers = shaperead('worldrivers', 'UseGeoCoords', true);
    geoshow(rivers, 'Color', 'blue')
    cities = shaperead('worldcities', 'UseGeoCoords', true);
    geoshow(cities, 'Marker', '.', 'Color', 'red')
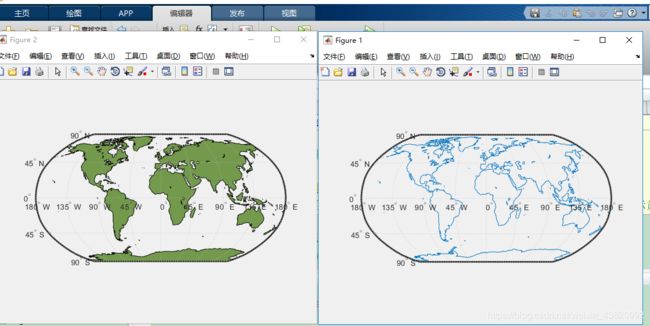
5.第六张图,啊呸呸呸!!错了,第五张,这次画了两张图,还有点小错误,需要就拿走,不喜勿喷哦

clear;clc;close all
maps %查看当前可用的地图投影方式
worldmap world %绘制世界地图
load coast %导入数据,全球海岸线
patchm(lat,long,'y'); %创建补片图像对象,是底层的图像函数,lat和long为经纬度,y表示黄色填充
%% 设置属性
setm(gca);%查看当前可以设置的所有图形坐标轴(map axes)的属性
setm(gca,'Frame','on');%使框架可见
getm(gca,'Frame');%使用getm可以获取指定的图形坐标轴的属性
setm(gca,'Grid','on');%打开网格
setm(gca,'MLabelLocation',60);%标上经度刻度标签,每隔60度
setm(gca,'MeridianLabel','on');%设置经度刻度标签可见
setm(gca,'PLabelLocation',[-90:30:90])%标上经度刻度标签,[-90:30:90]
setm(gca,'ParallelLabel','on');%设置经度刻度标签可见
setm(gca,'MLabelParallel','south');%将经度刻度标签放在南方,即下部
setm(gca,'Origin',[0,90,0]);%设置地图的中心位置和绕中心点和地心点的轴旋转角度[latitude longitude orientation]
setm(gca,'PLabelMeridian',90);%将纬度标签放置在经度为90度的地方


worldmap('world')
load coast %导入数据,全球海岸线
plotm(lat,long)


figure%将图画在另外的一张图表上,以免叠加
worldmap('world')
scaleruler


ax=worldmap('world')
load coast
geoshow(ax,lat,long,'Displaytype','Polygon','facecolor',[.45 .60 .30])
states=shaperead('worldstatelo.shp','UseGeoCoords',true);
for k=1:numel(states)
states(k).Number=k;
end
facecolors=makesymbolspec('Polygon',{'Number',[1 numel(states)],'facecolor',polcmap(numel(states))});
geoshow(ax,states,'Displaytype','Polygon','symbolspec',facecolors)


