QML Chart之ChartView(初解部分文档翻译) (-)
详细文档翻译连接:http://blog.csdn.net/qyvlik/article/details/52001754
PS:本文为本人测试了多少属性就写多少所以肯定不完整
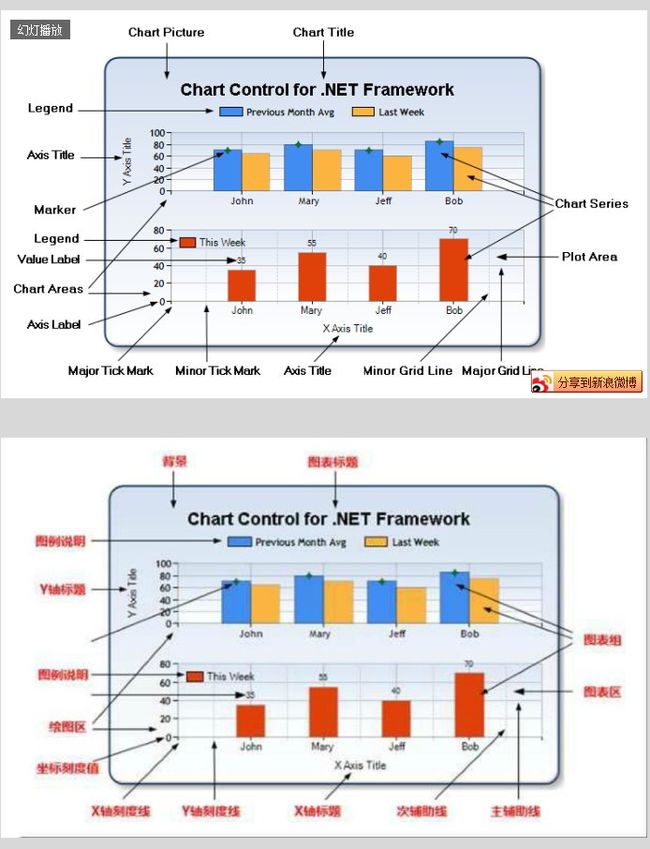
引用下上文推荐连接的图片(这个图片真不错,帮助理解一些关键词)

ChartView是负责展示不同系列图表的类
系列:
区域折线图系列:AreaSeries
箱盒状系列:BoxPlotSeries
条行/柱状/直方图系列:BarSeries,HorizontalBarSeries,HorizontalPercentBarSeries,HorizontalStackedBarSeries,
PercentBarSeries,StackedBarSeries
折线图:LineSeries
散点图:ScatterSeries
曲线图:SplineSeries
XY系列(似乎是基类,没注意看):XYSeries
主题列表theme :Theme定义主题例如:颜色,字体,线宽,背景
| Constant | Value |
|---|---|
| QChart::ChartThemeLight | 0 |
| QChart::ChartThemeBlueCerulean | 1 |
| QChart::ChartThemeDark | 2 |
| QChart::ChartThemeBrownSand | 3 |
| QChart::ChartThemeBlueNcs | 4 |
| QChart::ChartThemeHighContrast | 5 |
| QChart::ChartThemeBlueIcy | 6 |
| QChart::ChartThemeQt | 7 |
backgroundColor : color
设置背景色,但优先级似乎小于主题
backgroundRoundness : real
还能设定背景的圆的直径(不会表述,类似Rectangle的radius )
count : int
难道是返回图表中有多少系列吗?
dropShadowEnabled : bool
设置是否投影,从背景边缘投射
legend : Legend
一个控制图例的属性,控制其属性如:显示,对齐位置(暂时只简单测试到显示和对齐位置是可控的)等
ChartView {
  legend.visible: true
  legend.alignment: Qt.AlignBottom
  // Add a few series...
  }
margins : Margins
边距对象,控制边缘间距,内容与边缘的间距
margins.left:500;
plotArea : rect
图表区域:即图像的空间,不包括图例
plotAreaColor : color
设置图表区的颜色
title : string
图表标题,在图表区与边缘之间
titleColor : color
设置图表标题颜色
titleFont : Font
设置标题字体风格,例子
titleFont.pointSize: 20;
titleFont.bold: true;
antialiasing:true
设置反锯齿(虽然文档中似乎没有,但例子中有)